
Editor’s Note
All three reviewers initially recommended a revision that required full algorithm details for an important finding reported in this paper. The Action Editor (RH) encouraged resubmission with these details, noting that transparency would ultimately strengthen the paper and the science, outweighing short-term commercial drawbacks. The authors affirmatively addressed all other reviewer comments and suggestions but withheld algorithm details for proprietary reasons, citing common practice in scientific publishing (see Authors’ Statement). Two reviewers accepted this view; one strongly recommended rejection if the details were not included. We reviewed policies from other publishers on this issue, which typically defer to editorial judgment. Top journals have published papers omitting proprietary details, especially algorithms, balancing transparency with intellectual property protection. Without the algorithm details, the reported polygenic score variance predictions cannot be independently verified, but other key findings in the report can. In our view, the paper retains scientific merit and we accepted it. This is not an endorsement but reflects confidence that such work will inspire further research. An Associate Editor at ICA (TB) consults for the authors’ company but had no involvement in processing of or decisions about this manuscript and he was not informed of any reviews until after the final decision.—TC.
Author’s Statement
This manuscript’s scientific contribution centers on what rigorous validation reveals about the genetic architecture of cognitive ability, specifically, that direct genetic effects account for the large majority of PGS prediction, that measurement error substantially attenuates reported heritability estimates, and that cognitive PGS show predominantly beneficial associations with life and health outcomes. The validation methods (within-family designs, reliability-aware scaling, and convergent robustness estimators) are described and reproducible for any researcher with approved access to UK Biobank and ABCD. The specific score construction pipeline and scoring weights underlie an actively maintained commercial product and cannot be fully disclosed. We therefore describe score construction at a conceptual level and provide a benchmark analysis based on publicly available data (Supplement III), demonstrating that our conclusions generalize beyond the proprietary predictor.
Introduction
General cognitive ability (GCA) is a highly heritable trait (Polderman et al., 2015) consistently associated with diverse life outcomes (Strenze, 2007), ranging from educational and occupational attainment to physical (Calvin et al., 2017; Stern, 2012; Whalley, 2001) and mental health (Koenen et al., 2009; Zammit et al., 2004). Strengthening its genetic measurement is therefore highly relevant for health-related research (Abdellaoui et al., 2025).
Genetically, GCA is influenced by thousands of variants of small effect (Hill et al., 2019), in addition to high-effect rare variants (Chen et al., 2023). The growth of GWAS sample sizes for cognition-related phenotypes from under 10000 individuals (Butcher et al., 2008) to over 1 million participants (Lee et al., 2018) has enabled polygenic scores (PGS) with increasing predictive power. Recent genome-wide association studies have identified hundreds of genome-wide significant loci (Davies et al., 2018; Savage et al., 2018; Van Den Berg et al., 2025).
However, the interpretation of these scores remains contested. Influential analyses suggest that a substantial fraction of PGS prediction reflects indirect genetic effects rather than direct causal pathways (Young, 2019); reported SNP-heritabilities appear far below twin-based estimates, and concerns persist about cross-ancestry portability (Martin et al., 2019), gene–environment interactions, and antagonistic pleiotropy.
Using a new, optimized polygenic score (Methods), we address these challenges by isolating direct genetic effects from confounding and correcting for measurement error in brief cognitive assessments. We show that our analyses replicate when using a publicly available benchmark predictor, demonstrating that our findings reflect properties of cognitive genetic architecture rather than idiosyncrasies of a particular score.
Our analysis focuses on three critical domains of validity. First, we address the attenuation of genetic effects by measurement error. We apply psychometric reliability corrections and latent variable modeling to estimate the association between the PGS and latent general ability rather than noisy observed scores. We demonstrate through simulation and three convergent estimators that this correction recovers the true latent association.
Second, we examine the persistence of predictive power within families to isolate direct genetic effects from population stratification (Young, 2019). We extend this analysis beyond cognitive test scores to evaluate whether the PGS predicts real-world outcomes, including educational attainment, occupational status, and cardiometabolic health, within sibling pairs, thereby establishing its practical utility and assess the potential for antagonistic pleiotropy by conducting a broad screen of psychiatric and health outcomes to test for “off-target” effects. Finally, we systematically characterize the boundary conditions of polygenic prediction. We evaluate the portability of the score across diverse ancestry groups (Martin et al., 2019) in the ABCD cohort to quantify the expected decay in predictive power. Furthermore, we test for gene-environment interactions (GxE) with key socioeconomic factors, such as parental education and family income, to determine whether genetic effects on cognition are additive or dependent on environmental context.
By integrating these approaches, we demonstrate that when measurement error is properly modeled, polygenic scores achieve substantial predictive accuracy for latent general ability that is robust to family-level confounding and broadly applicable across additive environmental contexts. These results suggest that previous concerns about the limited utility of cognitive PGS due to environmental confounding, missing heritability or context-dependence may be overstated when appropriate validation methods are employed.
Within-family Validation
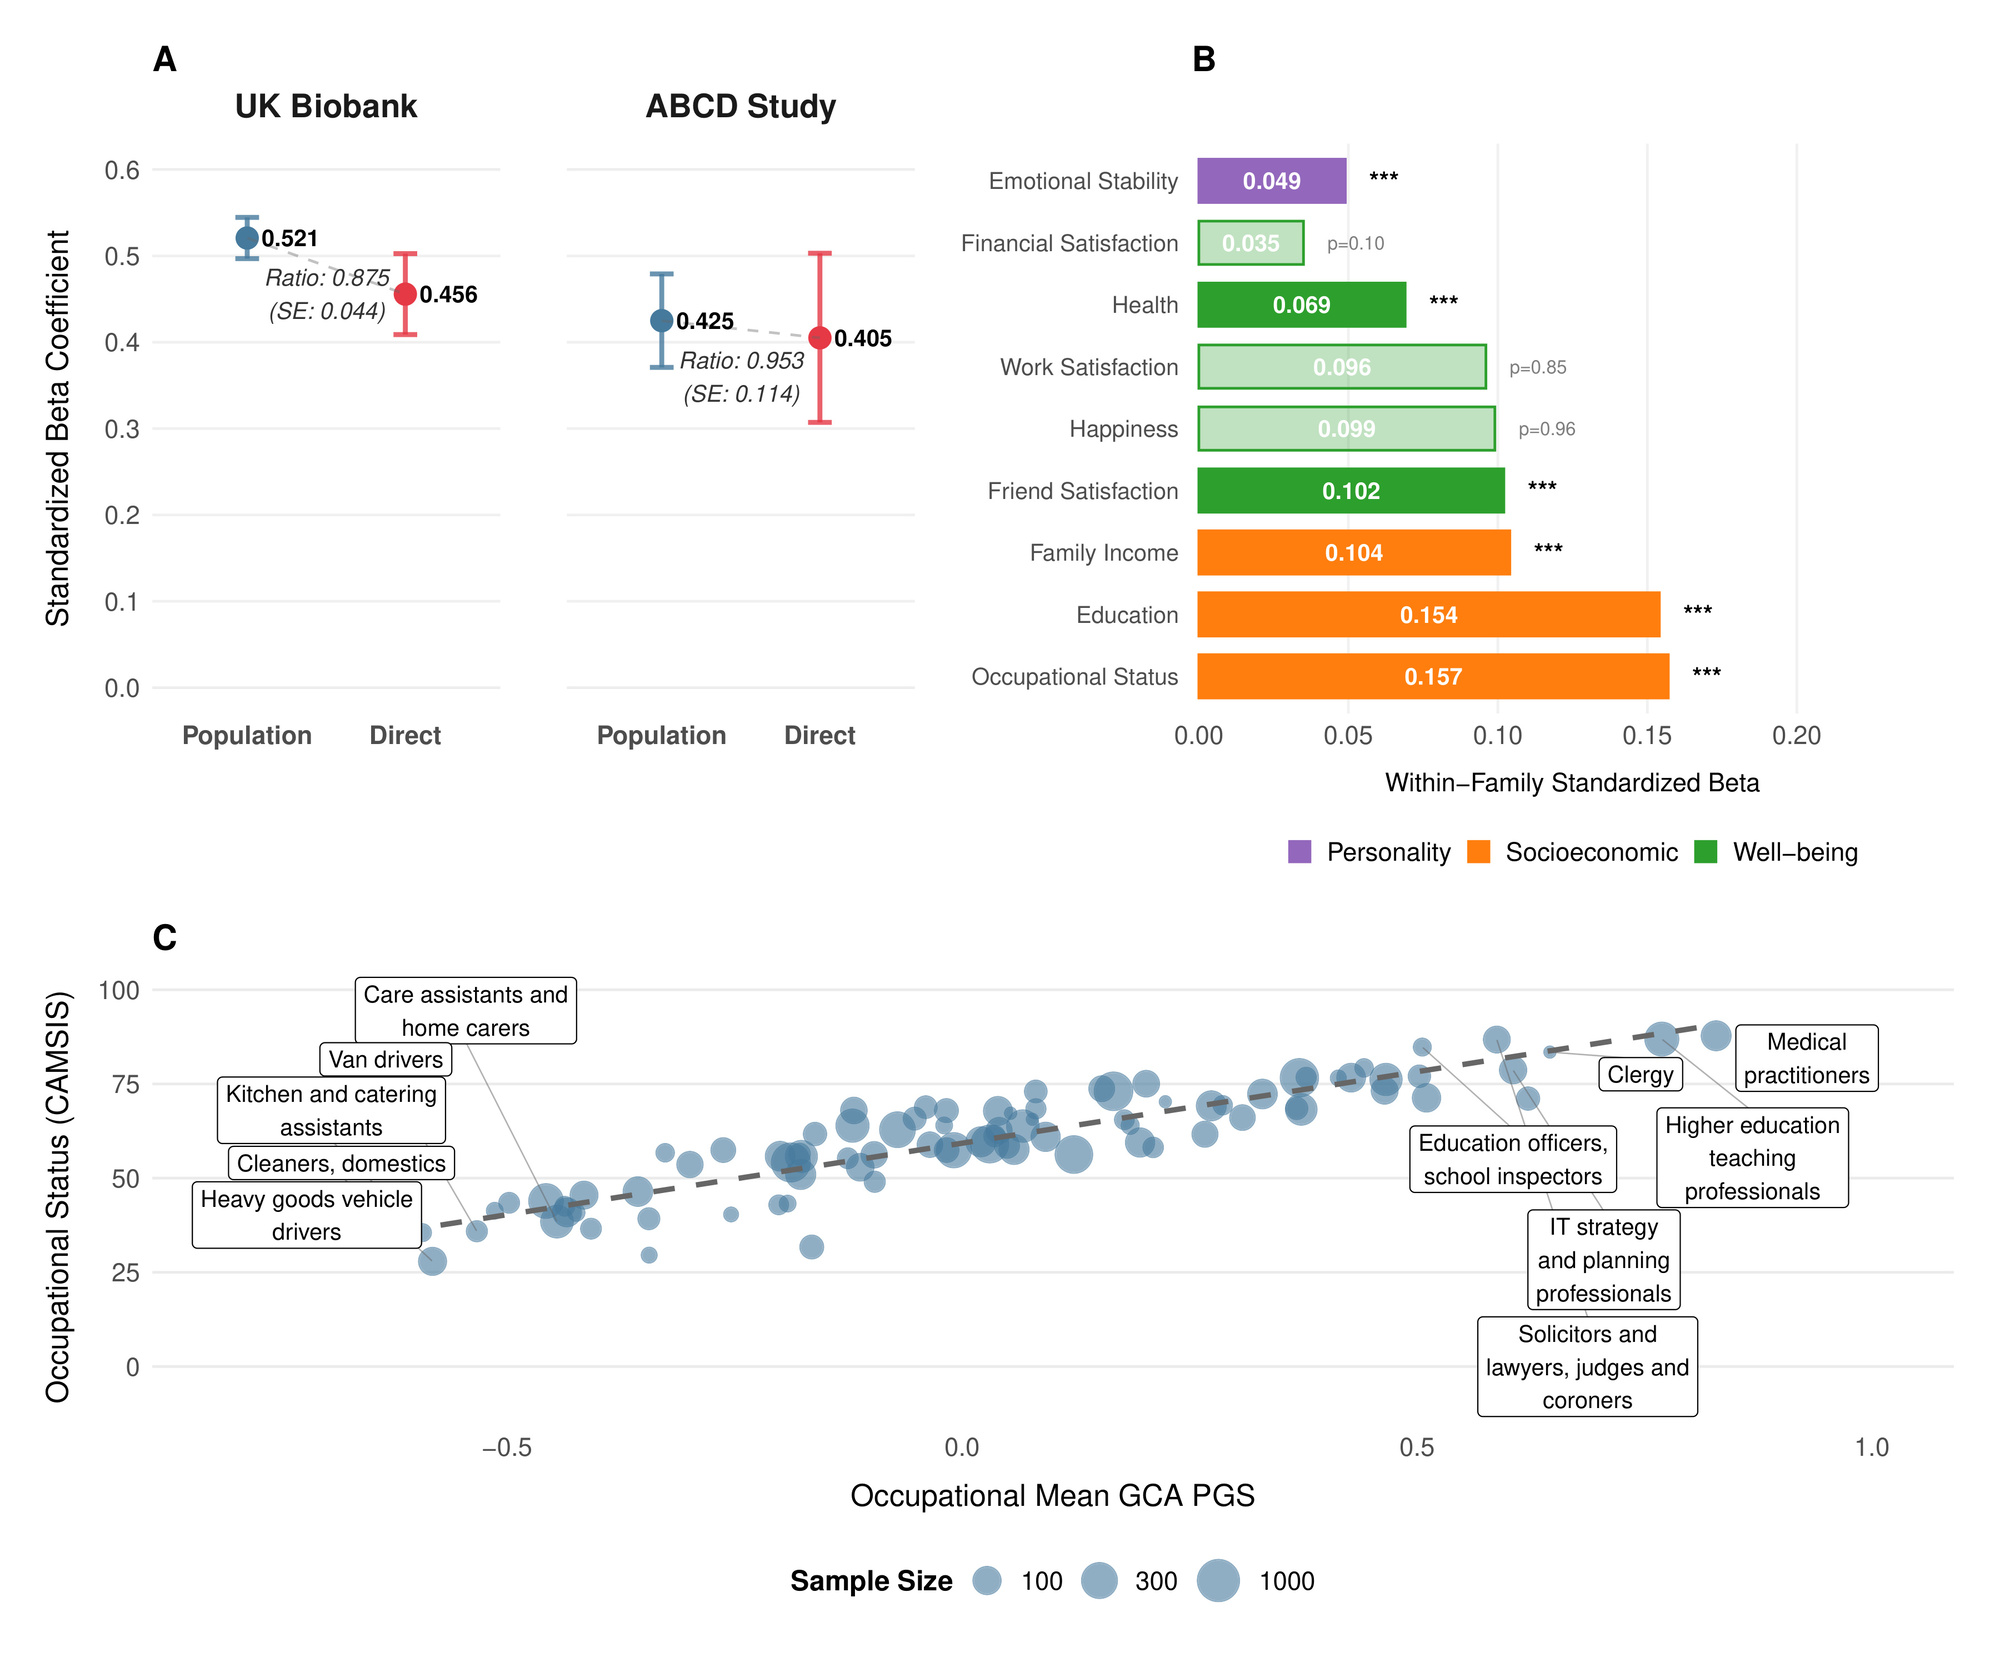
PGS prediction ability among unrelated individuals can be higher than among individuals within the same family. Within families, genetic variation arises solely from random Mendelian segregation and recombination events. In contrast, predictions among unrelated individuals can also capture gene-environment correlations induced by population stratification, indirect genetic effects (the influence of alleles in relatives on the focal individual via the family environment), and correlations with other genetic factors not directly measured by the score. Such correlations often result from assortative mating and other forms of non-random mating (Kong et al., 2018; Young et al., 2022). We therefore validated our GCA PGS in two independent hold-out samples, examining both its prediction ability among unrelated individuals and within-family (Table 1 and Figure 1).
In a sample of 4642 European ancestry sibling pairs from UK Biobank with complete fluid intelligence/verbal-numerical reasoning (VNR)[1] data, we tested associations with VNR after controlling for age, sex and their interaction, as well as 10 genetic principal components[2]. The PGS coefficient (with residualized phenotype and PGS standardized to have variance 1, corresponding to the correlation coefficient with the residualized phenotype[3]) without family fixed-effects was 0.406 (SE 0.009), corresponding to an of 16.4% (95% confidence interval: After adding family-fixed effects, we estimated the standardized direct effect of the PGS to be 0.355 (SE 0.0218)[4], implying only slight attenuation within-family similar to that observed in the largest meta-analysis of such effects (Okbay et al., 2022) , but in contrast to more pronounced effect reduction recently reported in another dataset (Lin et al., 2025).[5]

We also validated in the ABCD Study (Volkow et al., 2018), a broadly representative sample (ages 9–10) from across the United States. We constructed a general cognitive ability factor from ten assessments including NIH Toolbox measures (Weintraub et al., 2013) (Picture Vocabulary, Flanker, List Sorting, Card Sorting, Pattern Comparison, Picture Sequence Memory, Oral Reading Recognition), WISC-V Matrix Reasoning (Wechsler, 2014), Little Man (Luciana et al., 2018), and Rey Auditory Verbal Learning Test trials (Rey, 1958), using the same validation methodology as in UK Biobank. Each score was first residualized for age, sex, and their interaction, then inverse rank-normal (IRNT) transformed. This measure of GCA showed good psychometric properties (McDonald’s and substantial heritability based on ACE decomposition in twin and sibling pairs and European ancestry pairs with complete data). Validating in this group of siblings and dizygotic twins, we obtained similar results to our analysis of VNR in UK Biobank (Table 1).
As a comparative metric of what an estimator based on published results might be able to achieve, we leveraged summary statistics from Savage et al. (2018), the largest published GCA GWAS to date, and used them to build an LDpred2 (Privé et al., 2020)-based polygenic score, which we validated similarly to our own predictor. The results are given in Supplement III and Table S13.
Considering Measurement Reliability
Genetic effects operate on latent general cognitive ability—often referred to as —rather than directly on the test scores obtained from any specific psychometric instrument (Panizzon et al., 2014). Because psychometric tests are inherently noisy proxies, observed scores contain measurement error that attenuates estimates of both SNP-based heritability and polygenic score associations. From a practical standpoint, it is unrealistic to assume that a brief, 13-item cognitive assessment like the UK Biobank fluid intelligence/VNR test (which takes only a few minutes to complete) measures general cognitive ability as reliably as a comprehensive, multi-hour assessment such as the Wechsler Adult Intelligence Scale battery. Although both tests aim to target the same underlying trait, the extensive item coverage of the Wechsler scales ensures substantially lower measurement error.
Applying a reliability correction thus places shorter and more extensive psychometric assessments on a common latent-trait scale, enabling accurate validation of genetic prediction and meaningful comparisons across measurement instruments. Furthermore, for applications such as predicting the differences in cognitive ability of embryos, the appropriate scale is the latent ability scale, not the observed scale, since differences in genotype at conception affect latent ability, not merely the scores on a test with less than perfect reliability.
To quantify and correct for this attenuation, we employ standard approaches from classical test theory. We assume the measured phenotype reflects an underlying latent ability with added measurement error. Reliability is defined as the proportion of variance in the observed measure due to variation in the latent trait:
ρ=Var(g)Var(gobs)
Under the standard assumption that measurement error is independent of genotype, genetic variance remains unchanged when transitioning from the latent trait to the observed measure, but total phenotypic variance increases, inflating the denominator of variance ratios.
If the SNP-heritability of the latent trait is then the SNP-heritability estimated from the observed measure is reduced proportionally to the reliability:
h2SNP,gobs=ρ⋅h2SNP,g⇒h2SNP,g=h2SNP,gobsρ
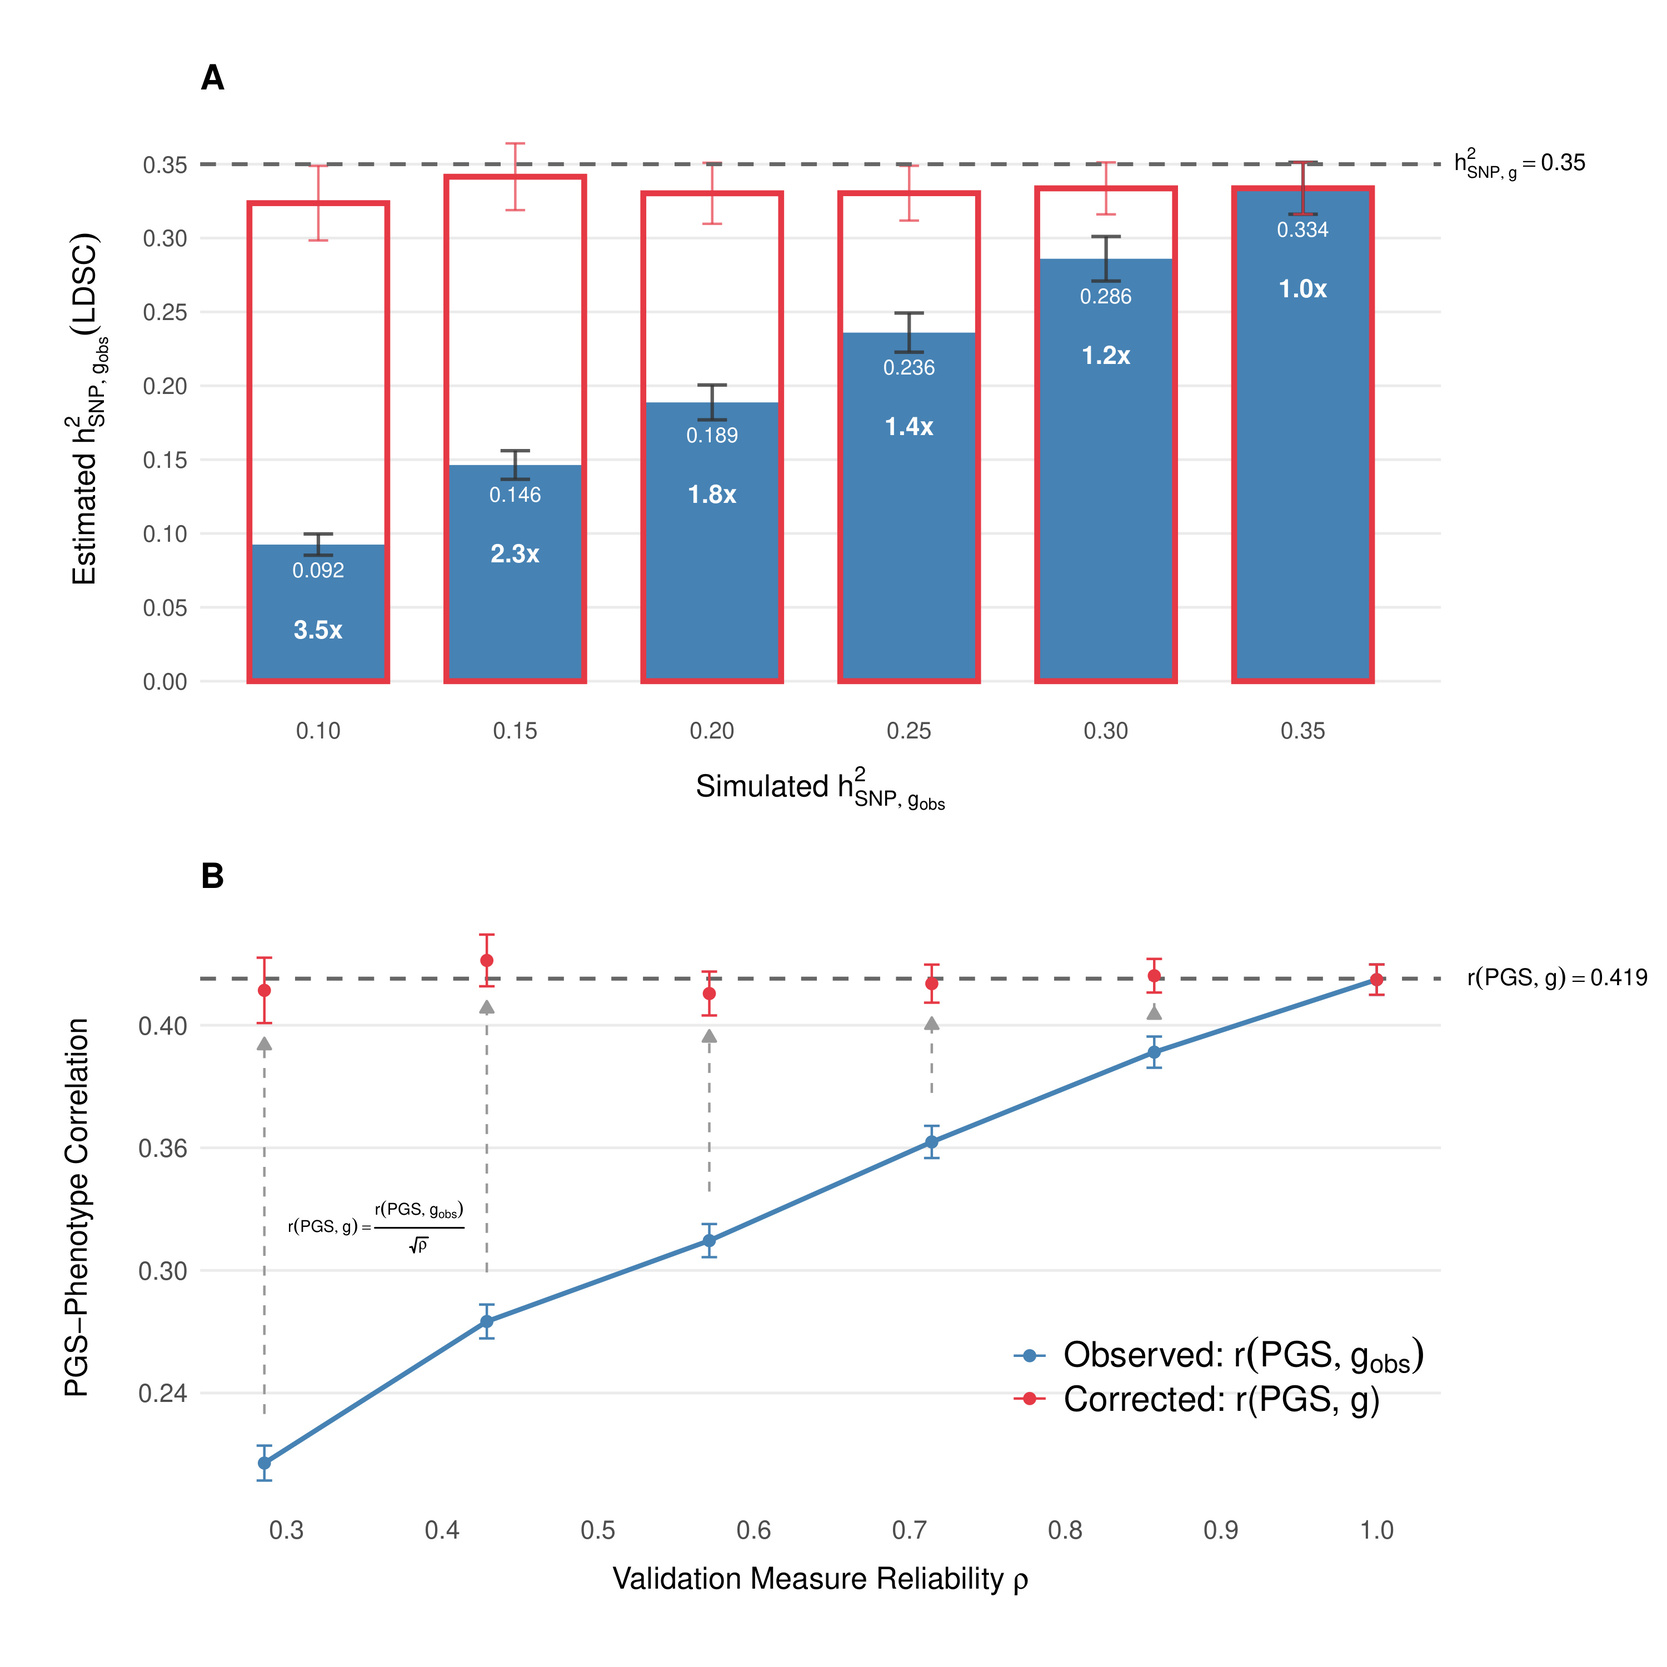
We verified this relationship through simulations (Figure 2A). Specifically, we simulated a phenotype with a SNP-based heritability of 0.35 using GCTA, assuming 10000 causal loci drawn from the HapMap SNP set and the subset of individuals of British ancestry in the UK Biobank. To mimic varying degrees of measurement error, we progressively introduced random noise into this latent phenotype, reducing the effective reliability such that observed heritabilities decreased stepwise to approximately 0.30, 0.25, 0.20, 0.15, and 0.10. We then performed a GWAS using PLINK on a randomly selected training subset comprising 80% of individuals and estimated SNP-heritability using Linkage Disequilibrium Score Regression (LDSC). As expected, decreasing reliability proportionally lowered the observed SNP-heritability estimates; however, after applying our reliability correction, these estimates consistently and accurately recovered the true latent heritability across all simulated scenarios (Figure 2A).
The correlation between a polygenic score and an observed measure similarly underestimates the true correlation with the latent trait due to measurement error. The standard correction for correlations (Spearman’s correction) gives:
r(PGS,g)=r(PGS,gobs)√ρ
where is the standardized PGS and the correlation.
We confirmed the effectiveness of this correction through additional simulations (Figure 2B). Using the GWAS summary statistics generated at different reliability levels, we constructed polygenic scores by clumping and thresholding SNP associations (threshold We then validated these scores within the aforementioned 20% test set of 68514 UK Biobank participants of British ancestry. At perfect reliability, the true correlation given the unattenuated SNP-heritability of 0.35 was while lower reliability measures systematically underestimated the observed PGS-phenotype correlations. After applying the reliability correction, the estimates consistently recovered the true latent correlation across the range of reliabilities simulated (Figure 2B).

Thus, we adjust both the population-level and within-family standardized associations to account for reliability, yielding corrected latent-trait estimates and (Table 1 and Figure 2), using test-retest reliability for fluid intelligence/VNR in UKB from Fawns-Ritchie & Deary[6], and McDonald’s Omega that we calculated for our measure of general cognitive ability in ABCD[7]. Based on the UKB results, we estimate without family-fixed effects, and with family fixed-effects. The latter reflects the standardized direct effect of the PGS on latent Our results based on ABCD indicated slightly lower correlation with latent than in the UK Biobank SE 0.0259), possibly due to lower heritability at ages 9–10 than in adulthood (Bouchard, 2013), as well as the fact that, in contrast to UKB, the ABCD PGS was constructed from imputed chip data, which is known to attenuate PGS-outcome associations (Li et al., 2021). The fixed-effects inverse-variance weighted meta-analysis estimate of the within-family correlation with latent is
The validity of these adjustments is independently confirmed by a separate approach using Common-Path Slope estimation, an errors-in-variables correlated-vectors regression under a one-factor MIMIC model (see Supplement I): because both the PGS and the observed are imperfect measures of the same latent trait, their associations with external outcomes should differ only by a constant multiplicative factor if the PGS acts primarily via Concretely, across outcomes we expect with a line through the origin; the slope captures the relative attenuation from measurement error in and limited predictive performance of the PGS. Fitting an errors-in-variables (Deming) regression to and combining the slope with the population effect PGS- association recovers the latent correlation and the implied reliability of the observed
Within ABCD, across 20 explicitly non-cognitive outcomes selected for an exploratory pleiotropic scan (see below), the estimated Deming regression slope was Under a simple latent-factor model where PGS and measure the same latent trait, we can combine the association between PGS and observed GCA for ABCD given in Table 1, and use the Deming regression to estimate the latent correlation (95% CI 0.417–0.488). This is in line with our attenuation-corrected population estimates in both cohorts. The same identity implies for our GCA measure in ABCD a reliability of 0.705 (95% CI 0.595–0.815), which matches our psychometric reliability estimate using McDonald’s of 0.803 (for details, see Supplement 1).
To address psychometric skepticism about classical-test-theory deattenuation on potentially multidimensional batteries, we further re-estimated the association between the cognitive PGS and latent general ability using structural equation models with family-clustered (robust) standard errors and tested measurement invariance (see Supplement II). Because the latent models define a technically slightly different phenotype (multi-test latent estimated by SEM and fit with FIML on individuals), we report them in a separate table. Table 2 shows the latent-scale within-family slope. Whereas a simple one-factor model fit the UKB data well, the ABCD data were better captured by a hierarchical model with three first-order domains loading on (Supplementary Table S9). The within-family standardized latent coefficients are in both cohorts, closely matching the reliability-corrected within-family estimates. In contrast to the classical test theory-derived results presented above, latent variable-based population estimates align well between both cohorts, closing the gap in performance between UK Biobank and ABCD and demonstrating that our headline results do not hinge on a single reliability parameter. We further verified metric measurement invariance across PGS strata and found no material item-level differential prediction (DIF) by within-family PGS (see Supplementary Tables S10–S12).
Within-family PGS effects on life outcomes
Phenotypically, cognitive ability is associated with diverse life outcomes (Calvin et al., 2017; Strenze, 2007). Figure 1B demonstrates which associations persist within families, providing evidence for causal relationships between the polygenic score and several important life outcomes. Within UK Biobank sibling pairs, a one standard deviation increase in the polygenic score predicted 0.154 SD higher educational attainment We also observed significant associations with occupational status measured by CAMSIS scores and family income aligning with known associations on cognitive ability and socioeconomic attainment (Marks, 2022).
The polygenic score was positively associated with better self-reported health higher satisfaction with friendships and lower neuroticism (higher emotional stability) However, we found no significant within-family associations with general happiness or work satisfaction These null findings for subjective wellbeing (albeit potentially a result of limited power), align with behavioral genetic studies showing that while GCA correlates with life outcomes, it has limited direct effects on subjective well-being (Bartels, 2015).
As an additional confirmation of validity, Figure 1C illustrates how mean polygenic scores vary across occupations in the UK Biobank. The systematic gradient aligns with cognitive demands of different professions (Schmidt & Hunter, 2004), with highest scores among medical practitioners, academics, and IT professionals, and lowest scores in manual occupations. (Wolfram, 2023)
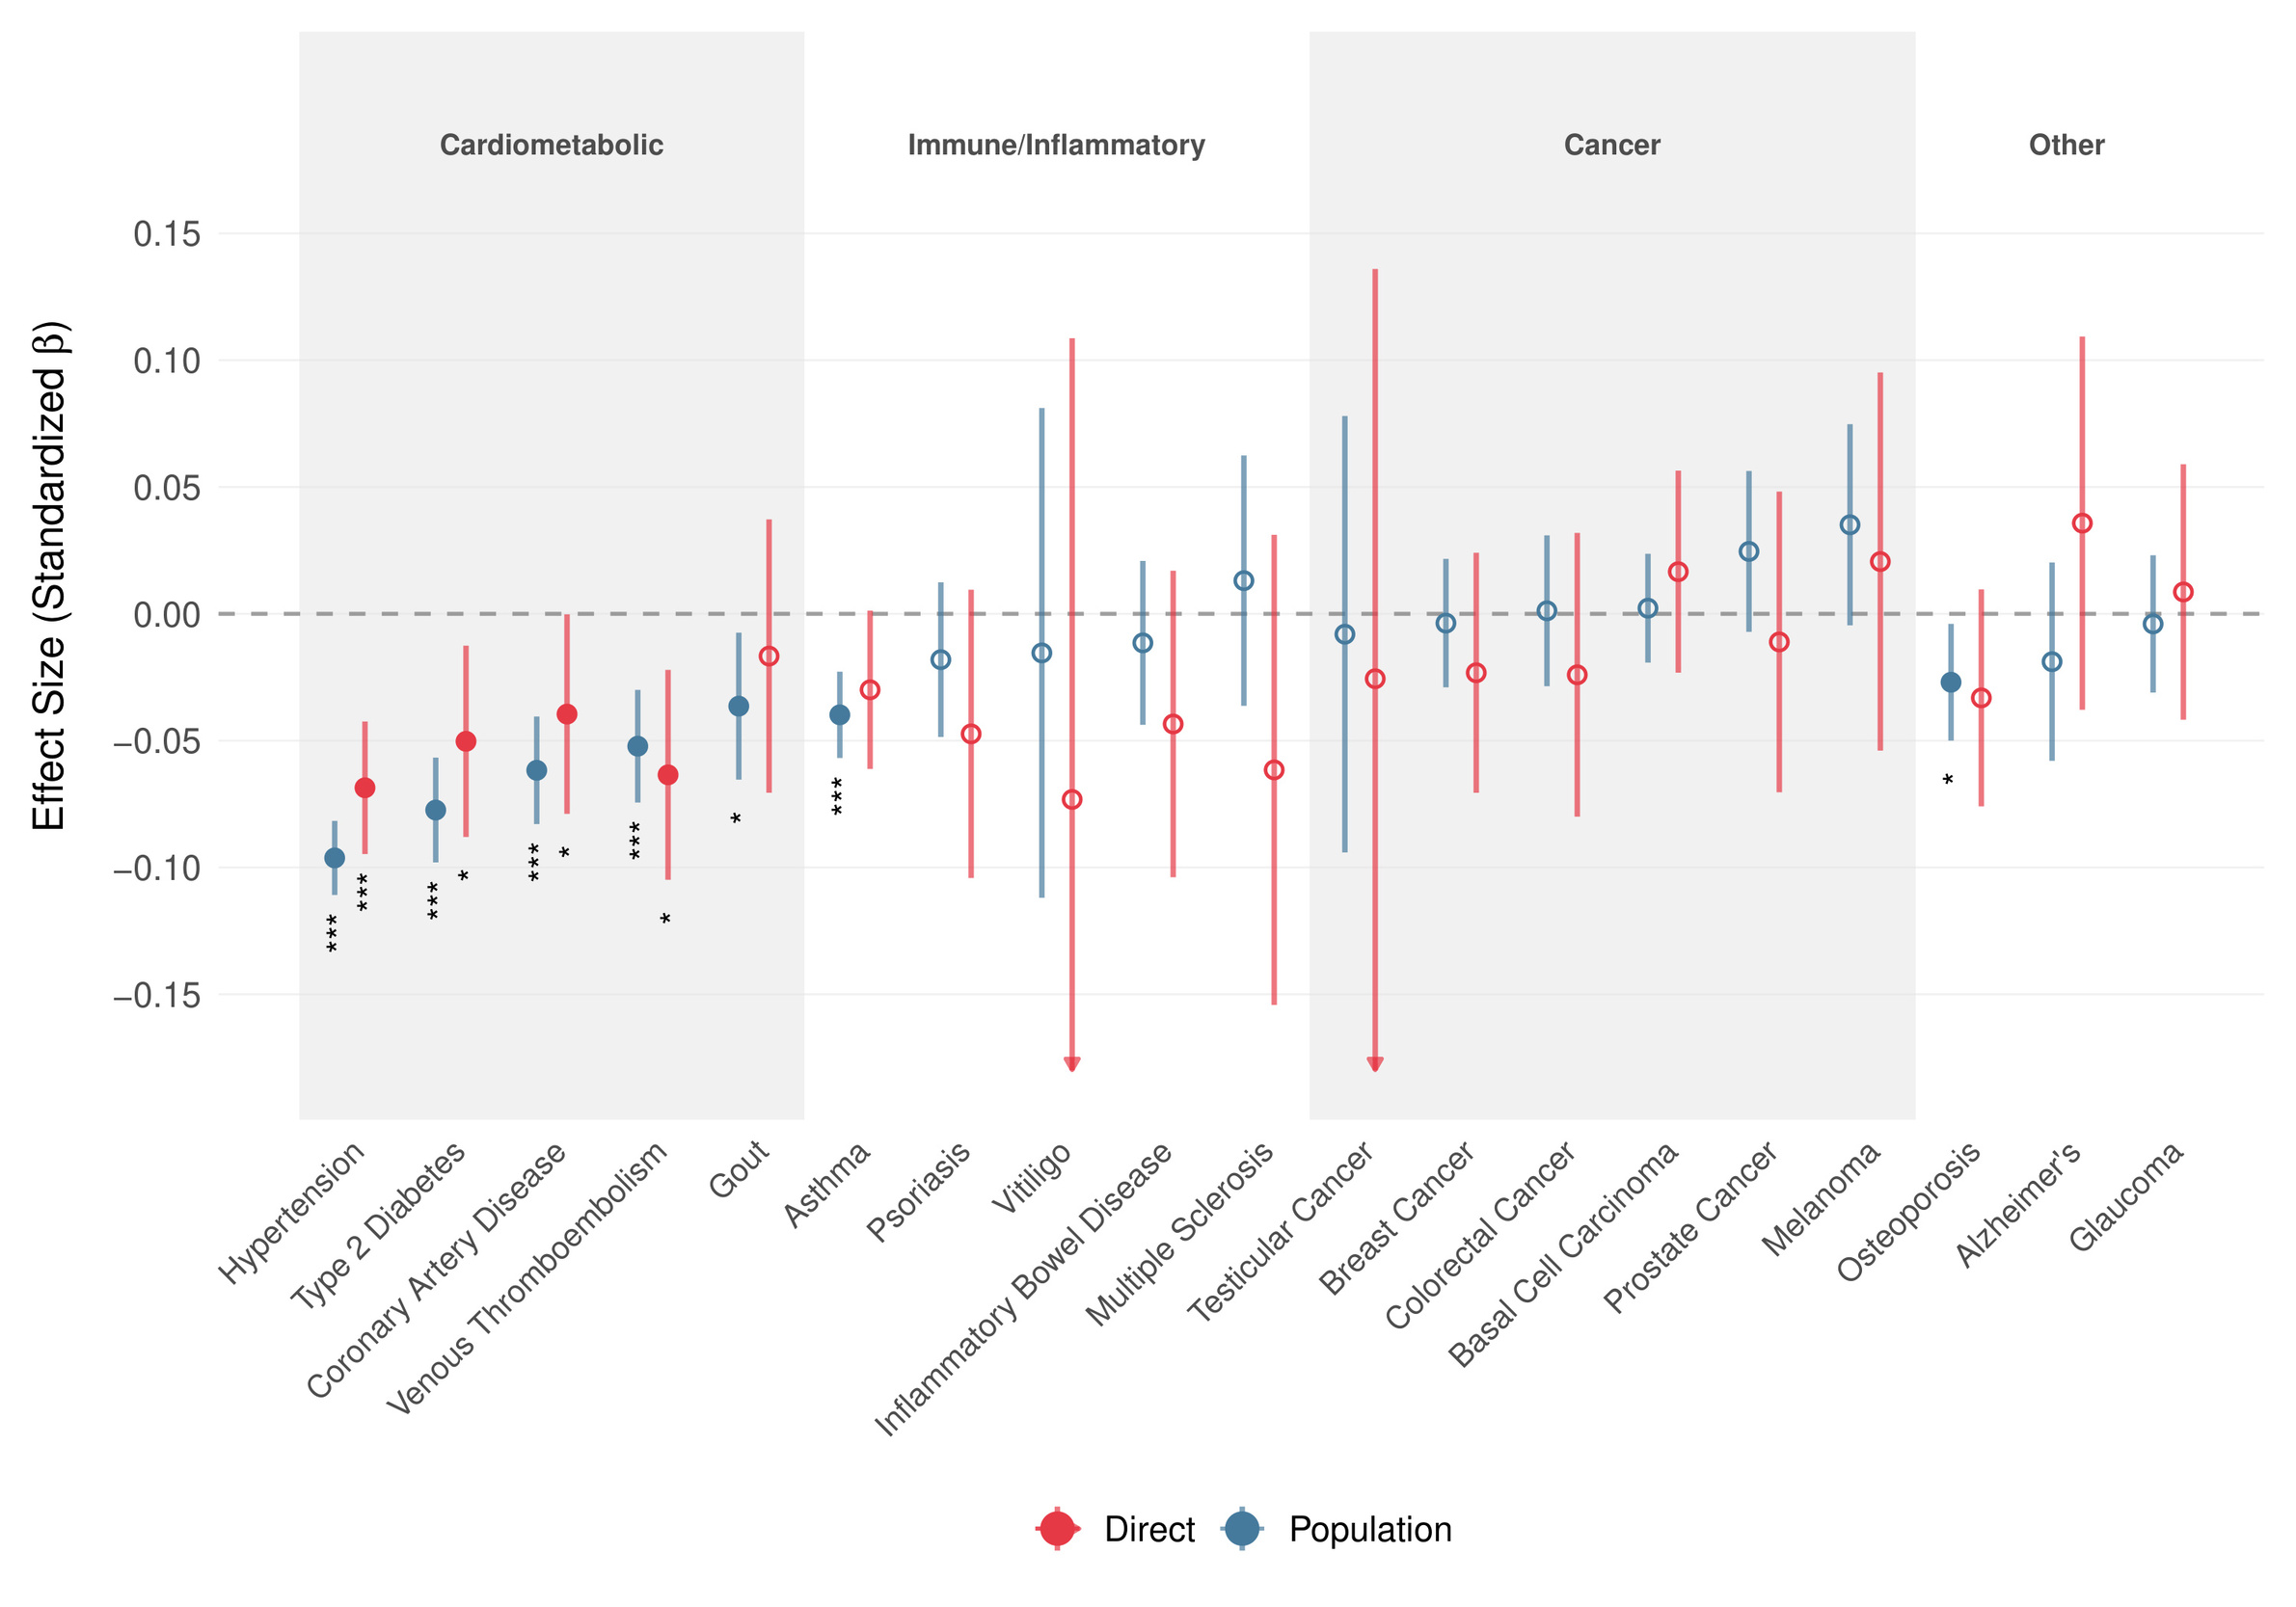
Predicting disease risk
Motivated by the within-family association of the GCA PGS with better self-reported health, we estimated its effect on 19 common diseases using snipar in up to 17661 UKB sibling sets (Figure 3). At the population level, the PGS showed broadly protective associations with cardiometabolic diseases, which persisted within families. Direct genetic effects remained negative for all five cardiometabolic outcomes, though due to limited power, Bonferroni-significance was only achieved for hypertension. Direct genetic effect estimates for immune/inflammatory and cancer outcomes were generally small or imprecise. Overall, 14 of 19 outcomes showed the same direction for population and direct estimates, 12 of which indicate protective effects, lending further evidence to the hypothesis that part of the favorable health association of higher cognitive ability reflects direct effects rather than only family-level or population confounding.
We observed no significant association between the GCA polygenic score and Alzheimer’s disease risk in our within-family analyses, though AD cases were rare in the sibling sample (N = 461) and most participants remain below typical dementia onset age.
Cross-Ancestry Performance Declines in Line with Expectations
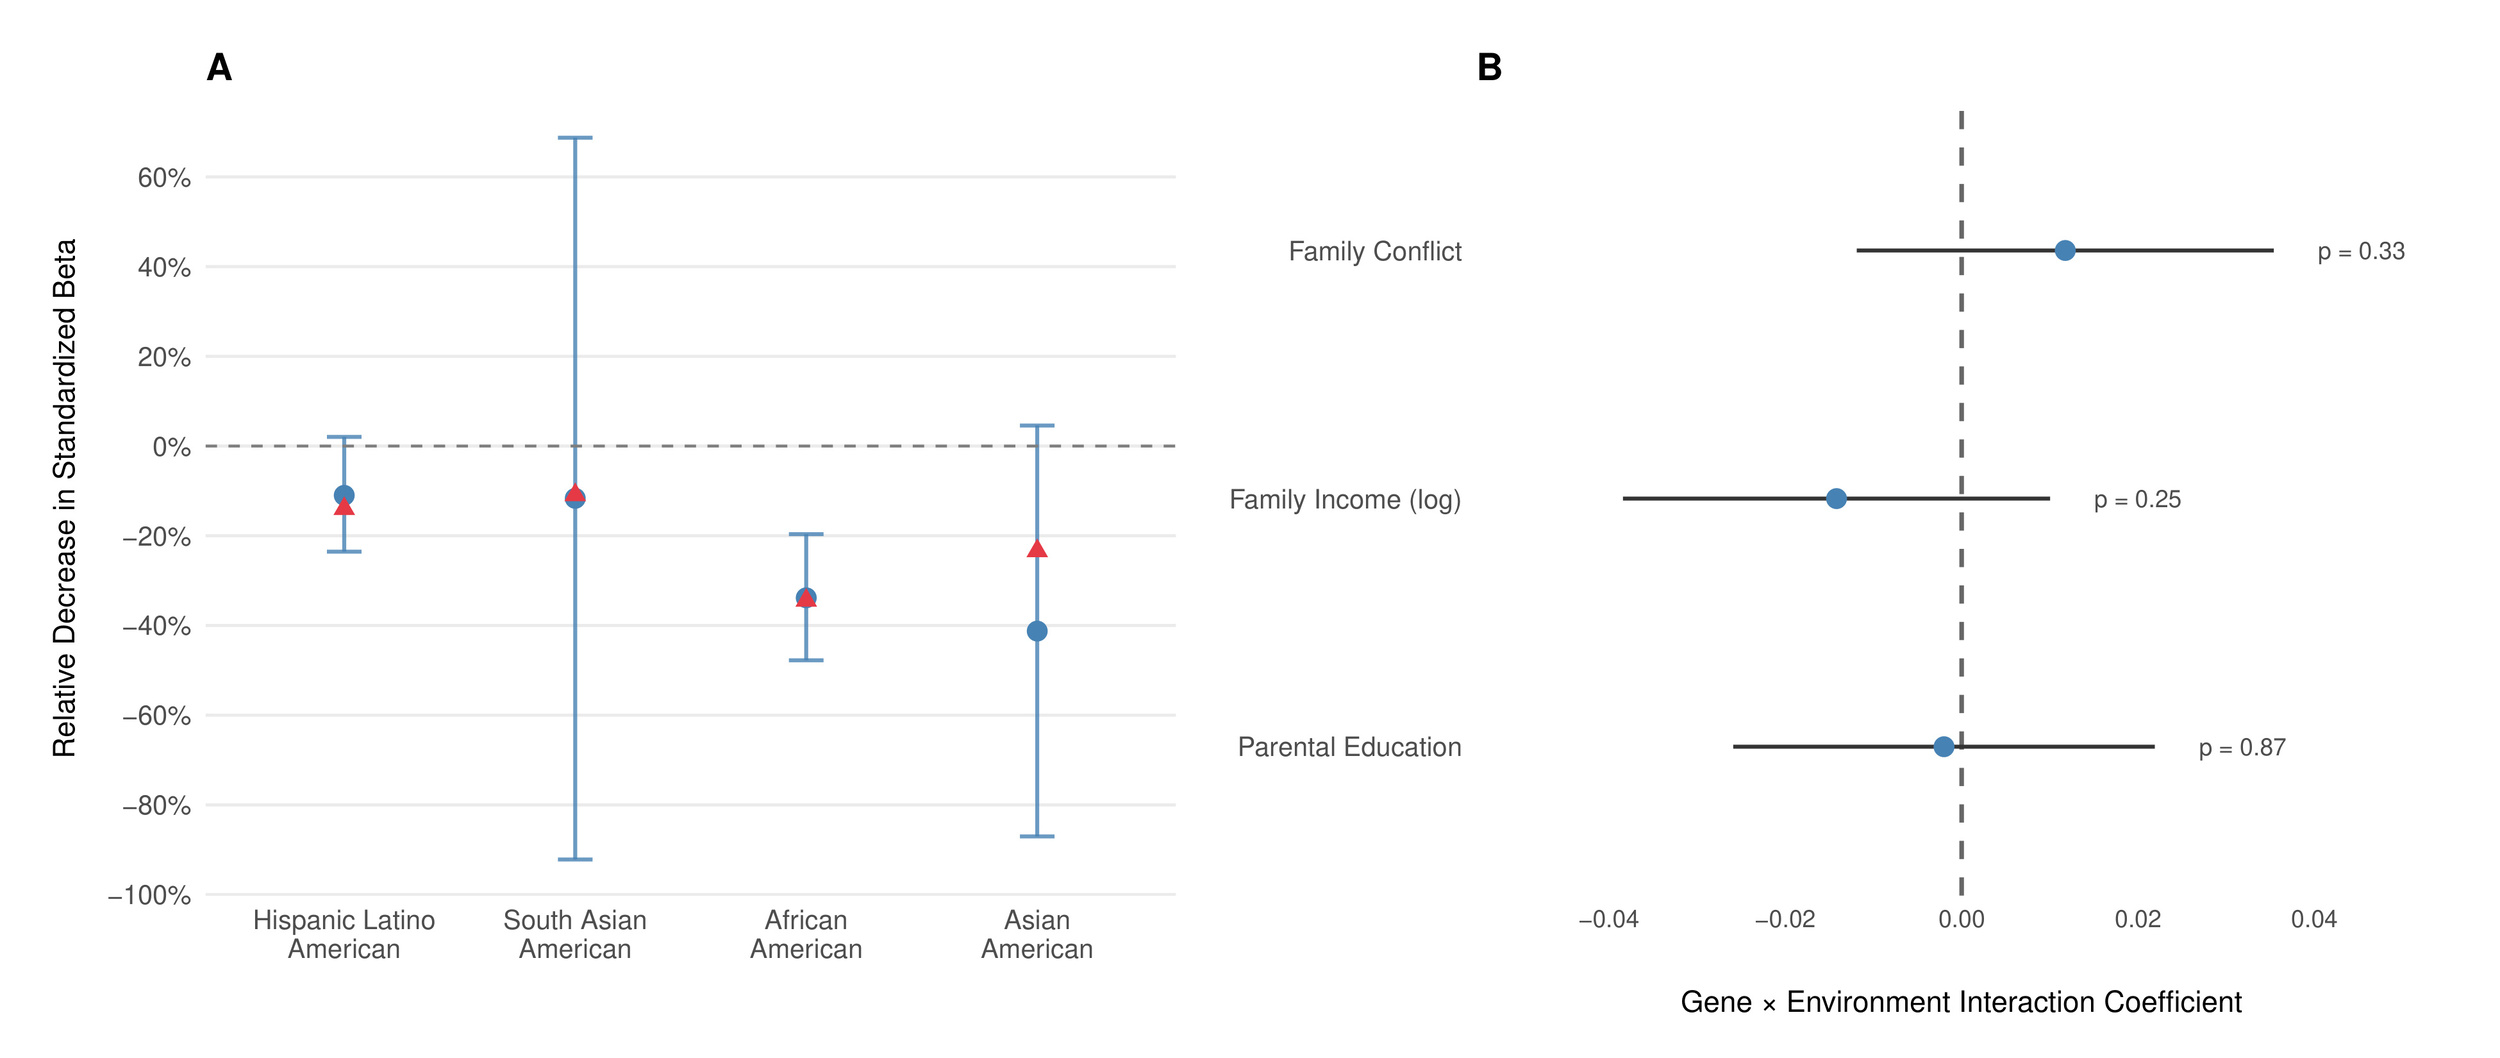
Polygenic scores typically show substantially reduced performance in ancestry groups not represented in the training data due to differences in linkage disequilibrium patterns and allele frequencies among other factors (Mostafavi et al., 2020). Figure 4A shows our score’s relative population-level performance in the ABCD Study for individuals of non-European ancestries. The score retained 89% of its standardized effect size in Hispanic/Latino Americans 88% in South Asian Americans 66% in African Americans and 59% in East Asian Americans relative to European Americans. Moore et al. (Moore et al., 2025) estimated the expected effect reduction for scores built using methods similar to the one employed here, which our results (despite noise due to small sample sizes) closely track (Figure 4A).

No Evidence for Gene-Environment Interactions
Gene-environment interactions for cognitive ability have often been proposed as an important factor in individual differences in cognitive ability. To assess whether there is any evidence for gene-environment interactions with our GCA PGS, we regressed the PGS, given environmental exposure, and examined their interaction on the cognitive ability measure we constructed in the European-American subset of ABCD Figure 4B shows no significant interactions between our polygenic score and environmental factors: parental education family income and family conflict This pattern is consistent with findings from well-powered twin and administrative studies in non-U.S. and population-scale U.S. samples (Bates et al., 2016; Figlio et al., 2017; Hanscombe et al., 2012), and with contemporary ABCD analyses, which likewise find SES and PGS associations to be largely additive (Paul et al., 2024).[8] While we cannot rule out the existence of any gene-environment interaction, the current results indicate that the magnitude of such interactions is likely small relative to the main effect of the PGS, indicating that predictions that do not model such interactions will remain well calibrated.
Assessing Potential Pleiotropic Off-Target Effects
Concerns about the interpretation of polygenic scores for cognitive ability often center on unintended associations with genetically correlated traits, particularly autism spectrum disorder (ASD) (Grove et al., 2019) and anorexia nervosa (Watson et al., 2019), a phenomenon also called “antagonistic pleiotropy”. To directly address this, we screened for associations of our GCA PGS across 20 psychological traits in ABCD, including psychopathology, temperament, and autistic traits (see Materials & Methods).[9]

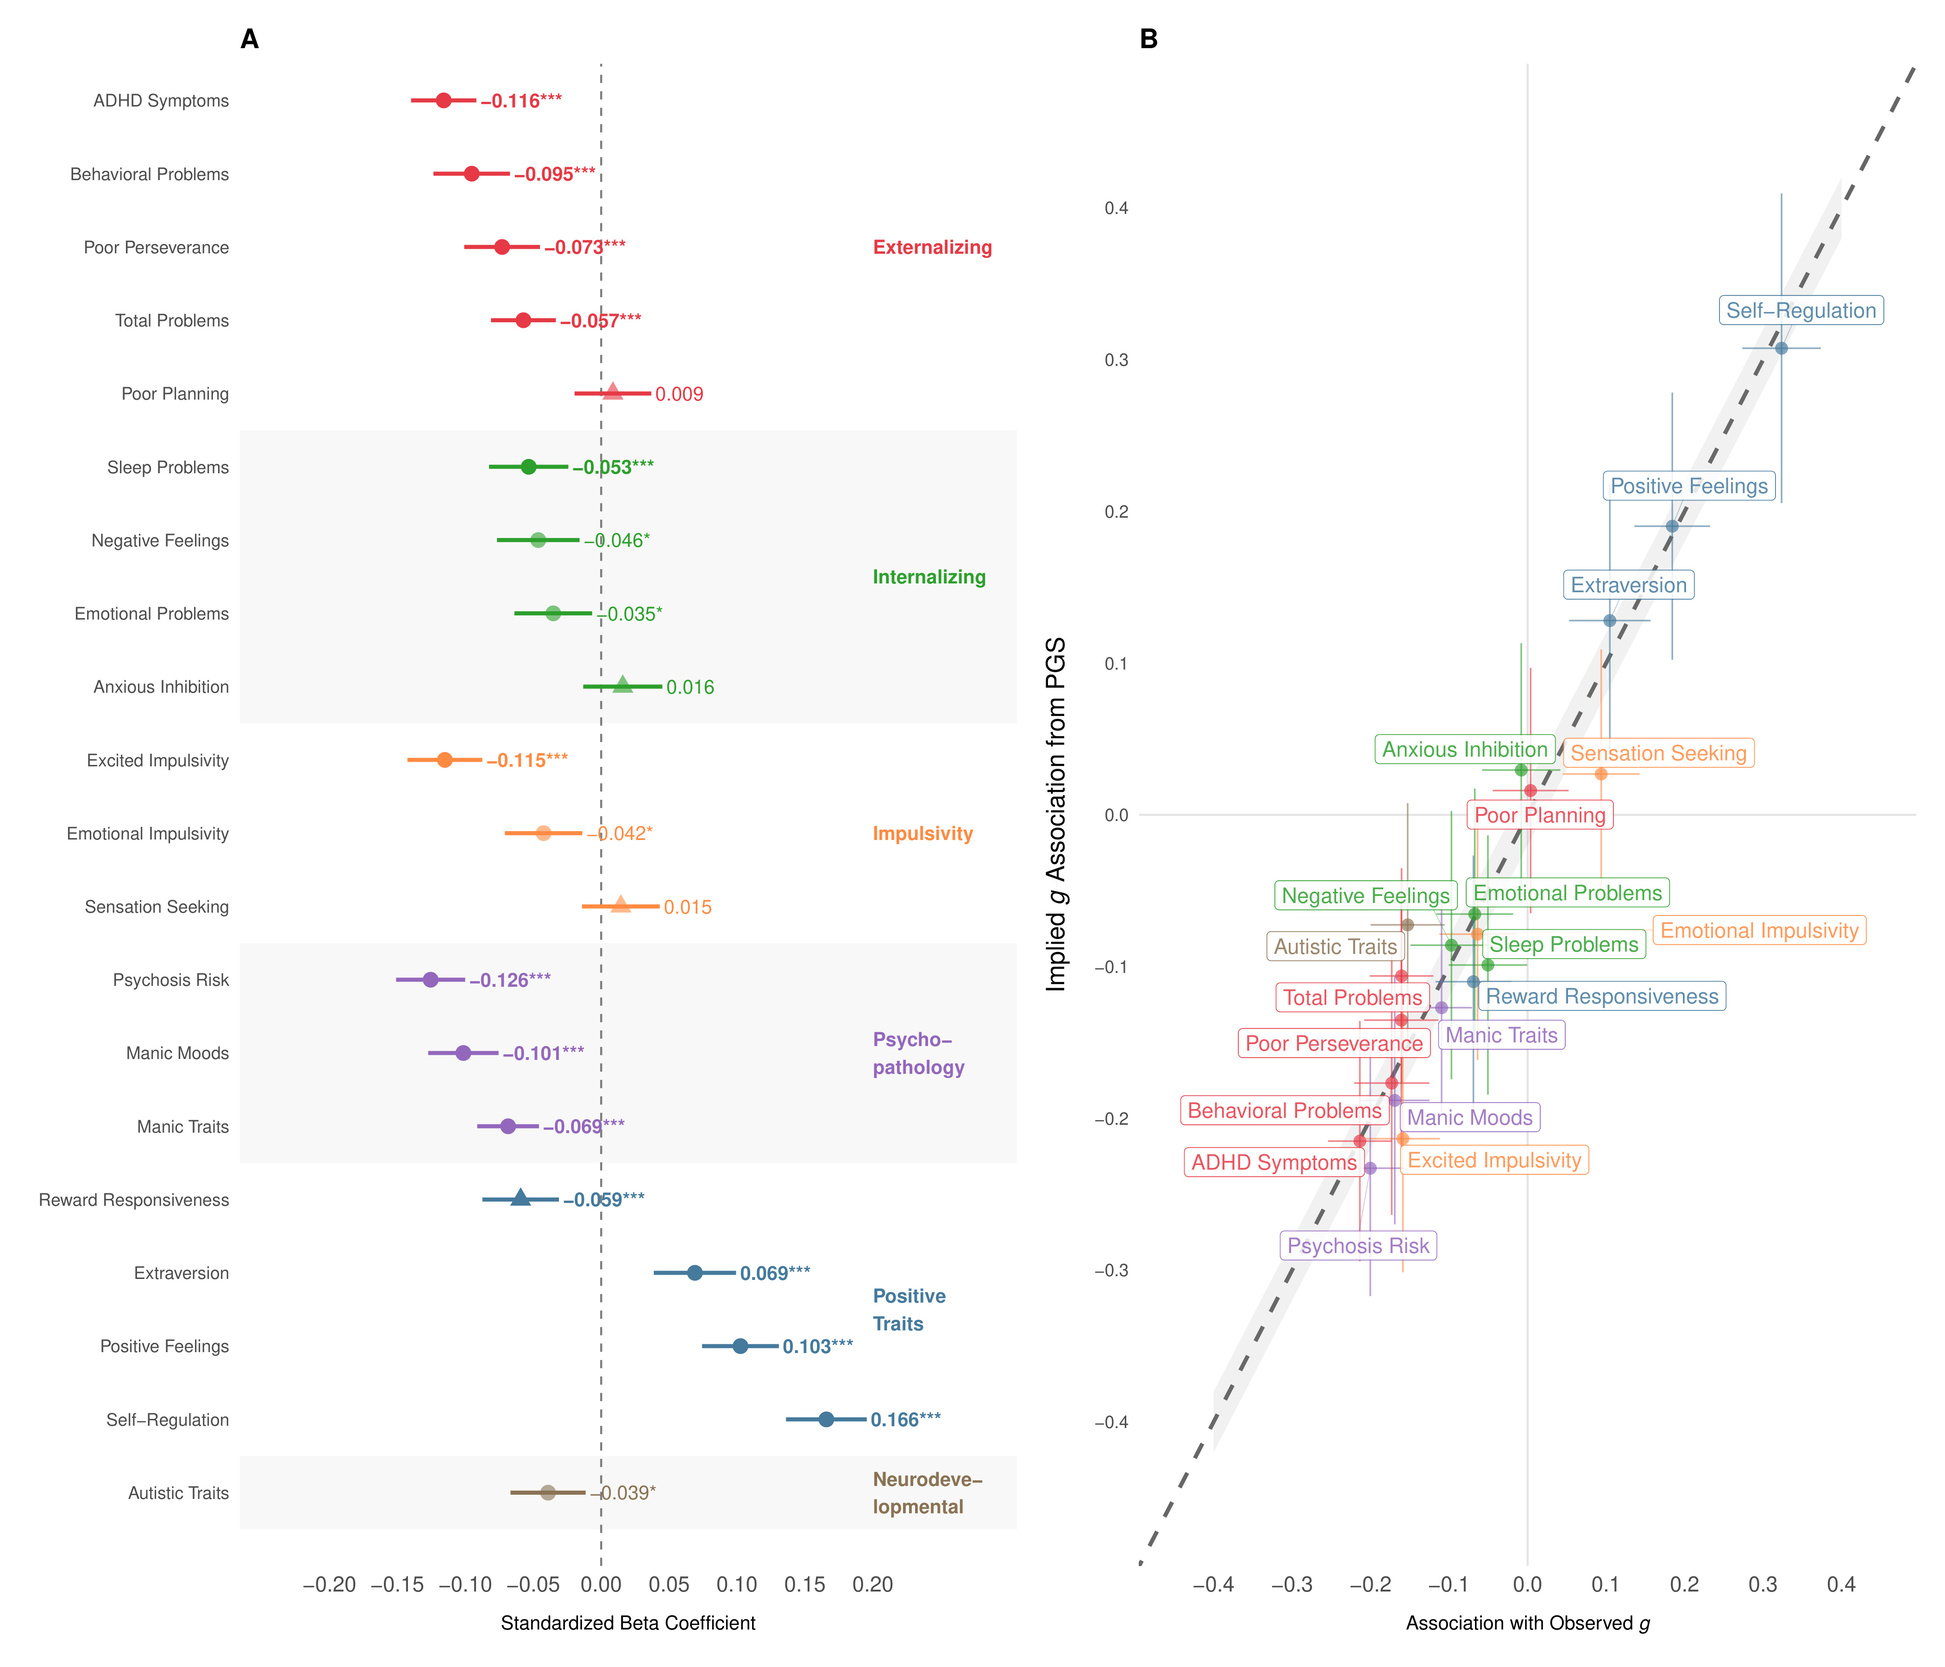
The results in Figure 5A show overwhelmingly beneficial associations between higher GCA PGS and outcomes indicative of improved psychological functioning. Specifically, a higher GCA PGS correlated with fewer psychotic-like symptoms lower ADHD symptoms reduced externalizing behaviors fewer sleep problems and increased positive affect Notably, we observed no significant positive association between our cognitive PGS and autistic symptoms; indeed, the association was weakly negative nominally significant, Bonferroni non-significant).
The Common-Path Slope analysis (see Supplement I) shown in Figure 5B, establishes that PGS associations scale almost perfectly with the corresponding associations of observed consistent with the PGS acting primarily via general ability rather than through idiosyncratic pathways specific to the PGS (pleiotropy). This supports the view that what we detect in the pleiotropy scan reflects the downstream correlates of g, not independent “off-target” mechanisms.
Overall, our comprehensive pleiotropy analysis provides little support for substantial negative off-target effects. Instead, higher cognitive ability genetic predispositions appear beneficial.
Conclusions
The interpretation of cognitive polygenic scores has been complicated by concerns about environmental confounding, limited cross-context generalizability, and the gap between PGS prediction and twin-based heritability estimates. Our results address each of these concerns through converging lines of evidence.
We achieved an of 16.4% for fluid intelligence/VNR in UKB, which represents a substantial advance over previous studies where performance has not exceeded 10% variance explained (Becker et al., 2021; Van Den Berg et al., 2025) and found this association to be robust within families. Reliability-corrected estimates indicate only slight attenuation within families a finding replicated using latent-variable structural equation modeling (Table 2) and confirmed using a reproducible benchmark predictor (Supplement III). These results are in line with recent findings showing that modeling cognitive ability at the latent level instead of relying solely on individual observed test scores improves polygenic prediction (Lin & Plomin, 2025). Although within-sibship GWAS can yield less biased estimates of direct genetic effects at individual loci (Howe et al., 2022), such analyses remain underpowered for cognitive phenotypes given current sibling sample sizes. Our results underscore that, across the phenotypes and predictors examined here, polygenic scores derived from conventional population-based GWAS capture substantial direct genetic effects, supporting their utility in contexts where only within-family variation is relevant (Ahangari et al., 2025; Craig et al., 2025; Moore et al., 2025).[10]
Beyond the magnitude of the effect, our analyses clarify the nature of the genetic influence on cognition. The significant within-family associations with educational attainment, occupational status, and family income provide evidence that these genetic effects translate into tangible life outcomes. Furthermore, the absence of gene-environment interactions with key socioeconomic variables strengthens the argument that, within the range of environments typical of European ancestry families in the USA, polygenic effects on cognition operate in a largely additive manner.
The public health relevance of this framework is reinforced by our disease prediction analyses. The consistently protective direct effects on cardiometabolic outcomes align with Mendelian randomization evidence regarding coronary artery disease and hypertension (Wang et al., 2023; Yang et al., 2022), suggesting these effects plausibly operate through behavioral pathways—such as diet and treatment adherence—that are influenced by cognitive ability. While our exploratory pleiotropy analysis indicated predominantly beneficial associations with psychological outcomes, future studies with larger sibling cohorts are required to confirm these population-level indications. Conversely, the null within-family effect for Alzheimer’s disease must be interpreted with caution given the imperfect sensitivity of registry-based diagnoses (Wilkinson et al., 2019) and the potential confounding role of cognitive reserve.
Beyond validating a specific predictor, our reliability-aware approach has implications for how the field interprets SNP-heritability estimates, as it suggests that a substantial component of the apparent gap between SNP-h² and twin-h² in cognitive measures may reflect measurement unreliability. For instance, the relatively low SNP-based heritability observed for the fluid intelligence/VNR measure in the UK Biobank, given its low reliability likely underestimates the true common variant SNP heritability of which, applying the attenuation correction outlined above, may exceed 0.35. Drawing parallels from height, where a significant portion of heritability resides in rare variants (Wainschtein et al., 2022), it is plausible that whole-genome sequencing analyses combined with proper modeling of measurement reliability will substantially bridge the heritability gap observed between SNP- and twin-based estimates, where the latter might suffer substantially less from measurement error, given measurement on the same day and age, often by the same rater and that aspects of the error themselves might be heritable (Nivard, 2023). Indeed, recent whole-genome analyses indicate that common and rare variants (MAF can explain plausibly 33–40% of variation in cognitive ability (Wainschtein et al., 2025).
A key prediction of such a reliability-aware approach is that better psychometric measurement should yield higher SNP-based heritabilities. This highlights the potential value of professionally constructed assessments, such as military IQ tests or scholastic achievement exams, whose SNP- should more closely approximate the true heritability of latent Practically, these results underscore the importance of extensive pretesting of cognitive measures before their implementation in large biobank cohorts. When assessment time is limited, adaptive, computer-assisted testing could further enhance measurement precision.
Collectively, these results highlight the diverse research settings in which a powerful, rigorously validated GCA PGS can benefit future health-related research. By establishing a validation protocol that explicitly models measurement error and family-level confounding, we provide a template for the safe and effective use of polygenic prediction in causal inference and epidemiological applications.
Materials & Methods
Scope of Disclosure
The analyses in this manuscript are designed to evaluate polygenic prediction in population and within-family designs and to characterize the role of measurement reliability using three convergent estimators. However, the score construction pipeline (including the exact engineered-phenotype search procedure, imputation system implementation details, and the final integrated scoring weights) underlies an actively maintained commercial product. We therefore describe the score construction process at a conceptual level and provide additional sensitivity analyses using an alternative GWAS-based predictor in the Supplement to demonstrate that our main validation conclusions are not specific to the proprietary predictor.
Score Development
We developed our polygenic score through a novel and comprehensive phenotype engineering pipeline designed explicitly to enhance the genetic signal of cognitive ability within the UK Biobank, restricting the analyses to individuals within the European ancestry cluster (participants of Ashkenazi, Polish, Italian, and British descent, following Privé et al., 2022 (Privé et al., 2022)). Siblings in UKB (reserved for validation purposes) were excluded from any phenotype engineering and downstream analysis to avoid data leakage.
Rather than relying on the raw cognitive measures provided by UKB, we explored a high-dimensional space of alternative score definitions for each of the 11 core cognitive tasks. Concretely, for each task we generated various candidate metrics spanning a small number of families of transformations (e.g., alternative scaling/transformations of the raw score distribution; alternative ways of combining paradata where available; and alternative item-weighting strategies for multi-item tasks). We also considered nuisance-adjusted variants that differ in which pre-specified covariate sets are removed prior to genetic screening (e.g., basic demographics and assessment context variables). Each engineered phenotype was then subjected to a highly optimized, custom implementation of a GWAS + LDSC pipeline, which enabled a rapid estimation of approximate SNP-heritabilities, allowing us to select only the single phenotype with the highest genetic signal-to-noise ratio for each cognitive domain. Candidate selection was then followed by full discovery GWAS runs using the primary GWAS pipeline described below.
To address missingness in cognitive measures within UKB, we used an autoencoder-based imputation strategy to predict missing cognitive scores from a broad panel of non-genetic variables (demographic, socioeconomic, and occupational/assessment-related variables) and other available UKB measures. The imputation model was trained and evaluated using held-out individuals within the non-sibling discovery set to avoid information leakage into the sibling validation cohort. Imputed values were used to increase completeness for phenotype engineering and auxiliary GWAS inputs. The key within-family validation analyses are conducted on observed outcomes in the respective holdout cohorts.
This pipeline yielded a suite of optimized measures which formed the basis of internal discovery Genome-wide association studies (GWAS), which were subsequently conducted on these phenotypes using REGENIE (Mbatchou et al., 2021). Individuals failing standard genomic QC were excluded. All analyses controlled for age, sex, their interaction, and the first ten principal components of genetic ancestry.
The UK Biobank’s fluid intelligence/VNR test—comprising 13 offline-administered verbal-numerical reasoning items—was selected as the focal phenotype for our polygenic score training due to its substantial SNP-based heritability (LDSC and substantial non-imputed sample size Where multiple fluid intelligence/VNR assessments were available per participant, scores were averaged.
We further boosted statistical power by integrating our internal cognition GWAS results with publicly available summary statistics from cognition-related and genetically correlated traits, including neurological and academic phenotypes, as well as additional GWAS conducted in the UK Biobank on heritability-maximizing transformations of such traits. We did not use educational attainment in our analyses due to its reduced within-family predictive validity (Okbay et al., 2022). Given the substantial difference in the SNP set used in our internal GWAS and in external summary statistics, we systematically imputed variants absent from individual GWAS summary statistics to comprehensively capture genetic variation. Using a hierarchical, multi-stage multi-trait meta-analysis framework, we substantially increased the effective sample size available for our focal fluid intelligence/VNR measure, significantly enhancing statistical power.[11]
Finally, we derived the polygenic score from these integrated summary statistics using SBayesRC (Zheng et al., 2024), applying a hierarchical, annotation-informed prior across an expanded genome-wide variant set. Functional annotations used were curated to augment the standard BaselineLD (Gazal et al., 2017) annotation set, including among others, evolutionary conservation metrics, cell-type-specific chromatin accessibility, and neurodevelopmental gene expression profiles.
Reliability
Using GCTA, we simulated a latent phenotype with (an illustrative value, consistent with observed estimates after reliability correction) on the subset of individuals of British ancestry in the UK Biobank using HapMap SNPs, assuming 10000 causal loci; we then added mean-zero noise to reduce reliability levels to the level of observed as shown in Figure 2. We then performed a simple GWAS using PLINK on a randomly selected training subset comprising 80% of individuals and estimated SNP-heritability using LDSC. Validation used the 20% hold-out where simple C+T scores constructed using PRSice-2) were evaluated on the phenotypes of varying reliability.
Validation
Statistical models & inference
Let denote the residualized cognitive outcome and PGS the standardized polygenic score (both variance-scaled to 1 after residualization). In our main analysis, we estimate
yi=α+βPGSi+εi(Population model)
yif=αf+δPGSi+εi(Family fixed-effects model)
where are family dummies. With this scaling, coefficients correspond to semi-partial correlations. We report the attenuation ratio with clustered (by family) bootstrap SEs.
Using the snipar (Young et al., 2022) within-family modeling framework, we instead estimate
yif=βSNIPARPGSi+uf+εi(Population model)
yif=δSNIPARPGSi+αˆgpar(f)+uf+εi(Within-family model)
where is instead the average non-transmitted coefficient, the (imperfectly) imputed parental PGS for family and a family-level random effect. We likewise report the attenuation ratio with clustered (by family) bootstrap SEs.
UK Biobank
Sample
The UKB sibling cohort reserved for validation was held out from all discovery stages. Sibling pairs were identified from UKB relationship files. We restricted to the Privé et al. (2022) white-ancestry cluster (Ashkenazi, Polish, Italian, UK) and excluded genotyping outliers, sex-chromosome aneuploidies, and heterozygosity/missingness outliers. Phenotypically, 4642 families with two genotyped siblings with non-missing outcome were retained for the validation[12].
Measure
We validated against each participant’s first measure of the UKB offline fluid intelligence/VNR test, residualized for age, sex, their interaction and the first 10 PCs, Test–retest reliabilities (Pearson’s were taken from Fawns-Ritchie & Deary (2020) as specified in Table 1.
ABCD
Cognitive factor construction
At baseline (ages 9–10), we extracted raw scores from NIH Toolbox tasks (Picture Vocabulary, Flanker, List Sorting, Card Sorting, Pattern Comparison, Picture Sequence Memory, Oral Reading Recognition), WISC-V Matrix Reasoning (raw sum), Little Man Task (percent correct), and a composite of Rey Auditory Verbal Learning Test trials (mean across trials). Each score was first residualized for age, sex, and their interaction, then IRNT-transformed. We fit a one-factor model using the psych package – the first factor explained of variance and showed good reliability see Table 1). The resulting factor scores (residualized for age, sex, their interaction and the first 10 PCs) served as the ABCD validation outcome.
Sample
We identified European participants by reported ancestry (variable demo_race) being white and excluded individuals for whom multiple ancestry groups were given. From this set, we identified monozygotic and dizygotic twins as well as full siblings using the genetic paired_subjectid and rel_relationship fields. Following ABCD guidance, we excluded a small number of participants with inadequate visual acuity during testing
Twin-Heritability
Using independent MZ pairs and DZ/sibling pairs, we computed correlations within zygosity, then Falconer ACE components. Standard errors for correlations used Fisher’s transformation; ACE SEs were obtained by the delta method.
Comparative Baseline
To demonstrate that our validation framework generalizes to standard, reproducible cognitive polygenic predictors, we additionally constructed a genome-wide benchmark score using the results from Savage et al. (2018). Since publicly released summary statistics include the UK Biobank, we reconstructed their results while excluding our sibling validation sample. To achieve this, we sampled 142077 white British respondents who participated in the offline fluid intelligence/VNR test, as well as 53576 for whom only online test data was available. These numbers mirror those given in their paper, but explicitly exclude any siblings. This approach was feasible due to the increased availability of cognitive ability data since the original study was conducted. In cases where multiple data points were available for a participant, we used the first one. Using this data, we ran separate GWAS for the offline and online data and meta-analyzed them with summary statistics from Savage et al. (2018) excluding the UK Biobank. A widely used Bayesian shrinkage approach (LDpred2-auto) was used to construct a polygenic score which was subsequently used to rerun all validation analyses presented in the main text and beyond. Results are reported in Supplement III.
Associations with Other Outcomes
Within UKB sibling pairs, we regressed standardized outcomes (see Table S2 for a full list) on the standardized PGS with family fixed effects. Outcomes were pre-residualized (age, sex, PCs) and z-scored as before. Multiple testing was controlled via Bonferroni across
Occupational Stratification
We merged the sibling holdout with their PGS values, then joined occupation and CAMSIS from the ukbjobs package (Akimova et al., 2025). For each occupation we computed mean standardized PGS, mean CAMSIS and sample size per occupation. Occupations with validation individuals were excluded to reduce instability. We visualized mean PGS vs CAMSIS, displaying point size by and added an OLS trend line to summarize the occupational gradient.
Disease prediction
To examine the cognitive ability PGS’s capacity to predict disease outcomes within-families, we regressed binary outcomes on standardized sibling PGS values including or excluding imputed parental PGS values following the above snipar within-family modeling framework. Outcomes were analyzed using a generalized linear mixed model, fitted in R with the lme4 package’s glmer() function using the binomial probit link and including age, sex (except for sex-specific diseases) and the first 10 principal components as covariates. To achieve convergence for all 19 models, we set and used the bobyqa optimizer. The set of 19 disease outcomes were selected so as to include non-overlapping conditions collectively affecting multiple biological systems. Cases were identified within up to 17661 sibling sets from the UKB using ICD-10 hospital codes, OPCS-4 operation codes, medication usage, self-reports and responses to disease-specific surveys (Table S3).
Ethnic Portability
Effect reduction. In we estimated population-level standardized effects separately by genetic ancestry group, using the same QC, residualization and standardization as for the sibling sample. Groups were defined using parent-reported ancestry: EUR = “white”, AFR = “black”, AMR = “hispanic”, EAS = “chinese”, “korean”, “japanese”, “filipino”, SAS = “asian indian”. Children with more than one ancestry category (with the exception of AMR) were removed. For each group we fit and estimate relative performance For presentation, we summarized the relative decrease and its 95% confidence interval via parametric bootstrap using the estimated and SE for each group in Figure 4A.
Expected effect reduction. Moore et al. provided estimates for East Asian (58.7% relative and South Asian (79.4% relative populations. For African Americans, we used linear interpolation assuming 80% African/20% European ancestry based on their Nigerian validation (28.3% relative performance at 100% African ancestry). For Hispanic/Latino Americans, we applied Ding et al.'s (Ding et al., 2023) genetic distance framework: Hispanic/Latino populations cluster at intermediate genetic distances between Europeans and Africans in their analysis, reflecting their admixed ancestry. Using an intermediate distance of 0.32, a linear model based on Moore’s results predicts 74% relative corresponding to 86% retention of standardized effect size, which aligns well with our observed 89%.
Gene-Environment Interaction
We exploratorily tested moderation of the PGS effect in European-ancestry ABCD at baseline using three contexts, all using the same QC, residualization and standardization as for the sibling sample, in a standard regression framework:
Y=α+β1PGS+β2E+β3(PGS×E)+ε.
Moderators were Parental education : mean of primary and partner education, measured as number of years in education based on highest school grade or degree attained (demo_prnt_ed_v2, demo_prtnr_ed_v2). Family income : natural log of combined family income (demo_comb_income_v2). Family conflict : Sum of parent report on the Family Environment Scale conflict subscale (fes_p_ss_fc_pr).
Pleiotropy Analysis
To assess potential “off-target” pleiotropy associated with our cognitive ability PGS, we conducted a systematic pleiotropy screen across 20 psychological and neurodevelopmental outcomes in ABCD (ages 9–10, European-ancestry participants; see Table S4). Outcomes covered child psychopathology, temperament, affective traits, sleep, and autistic traits (SSRS). Each outcome was residualized for age, sex, and 10 genetic PCs, inverse-rank-normal transformed when needed, and standardized. Analyses were run at the population-level (between-family), maximizing power, and did not include sibling fixed-effects.
Associations were tested using standardized regressions, controlling the family-wise error rate with Bonferroni correction To clarify the clinical interpretation, each outcome was assigned a valence: associations were labeled “positive pleiotropy” if higher cognitive PGS correlated positively with beneficial traits (e.g., effortful control) or negatively with undesirable traits (e.g., ADHD symptoms), and “negative pleiotropy” otherwise. Given these analyses are between-family, effect sizes likely reflect upper bounds due to inflation from assortative mating and genetic nurture, and should thus primarily be interpreted for directionality.
Additionally, we applied the Common-Path Slope (CPS) method (Supplement I) to verify whether observed associations were mediated predominantly through general cognitive ability rather than independent, outcome-specific genetic pathways.
Acknowledgements
This research has been conducted using the UK Biobank Resource under Application Number #103244. This work uses data provided by patients and collected by the NHS as part of their care and support.
Furthermore, data used in the preparation of this article were obtained from the Adolescent Brain Cognitive Development (ABCD) Study (https://abcdstudy.org), held in the NIMH Data Archive (NDA) under application #21063. This is a multisite, longitudinal study designed to recruit more than 10000 children aged 9–10 and follow them over 10 years into early adulthood. The ABCD Study® is supported by the National Institutes of Health and additional federal partners under award numbers U01DA041048, U01DA050989, U01DA051016, U01DA041022, U01DA051018, U01DA051037, U01DA050987, U01DA041174, U01DA041106, U01DA041117, U01DA041028, U01DA041134, U01DA050988, U01DA051039, U01DA041156, U01DA041025, U01DA041120, U01DA051038, U01DA041148, U01DA041093, U01DA041089, U24DA041123, U24DA041147. A full list of supporters is available at https://abcdstudy.org/federal-partners.html. A listing of participating sites and a complete listing of the study investigators can be found at https://abcdstudy.org/consortium_members/. ABCD consortium investigators designed and implemented the study and/or provided data but did not necessarily participate in the analysis or writing of this report. This manuscript reflects the views of the authors and may not reflect the opinions or views of the NIH or ABCD consortium investigators.
Competing interests
All authors are employees of Herasight, Inc. and hold equity in the company.
Funding
This work was funded by Herasight, Inc.
UK Biobank labels this measure ‘fluid intelligence’; however, the items primarily assess verbal and numerical reasoning, so we refer to it as verbal–numerical reasoning (VNR) throughout, following existing literature (Lyall et al., 2016).
Repeating the UKB analyses with 40 genetic PCs (instead of 10) yielded materially identical results
We residualize phenotypes on standard covariates to remove non-genetic and ancestry-related structure prior to standardization; coefficients therefore reflect standardized associations between the PGS and covariate-adjusted phenotypes. As a robustness check, we additionally residualized the PGS on the same covariates (yielding strict partial correlations, i.e., residualizing both phenotype and PGS on covariates) and obtained essentially unchanged estimates: UKB - = 0.3468 (0.0213), = 0.4062 (0.00874); ABCD - = 0.3637 (0.0541), = 0.3836 (0.0231).
As controlling for principal components technically could be considered as conditioning on a collider in the context of a within-family model, we conducted a robustness check where we did not consider PCs, which did not affect the estimate
We conducted a further robustness check, using the within-family modeling framework of snipar, which boosts power for estimation of direct genetic effects via Mendelian imputation of parental genotypes (Young et al., 2022) (see Materials & Methods). We similarly found minimal and not significantly different attenuation within-family using this method (ratio =0.853, SE 0.039).
This published estimate aligns well with the Cronbach’s alpha as provided elsewhere (Hagenaars et al., 2016) as 0.62. We also estimated test-retest reliability in the sample of UKB participants that took the test twice over the years (N = 29,879) as 0.647.
We chose test–retest reliability for the UK Biobank fluid intelligence/VNR test because it is a single, brief cognitive assessment administered at two time points. Test–retest reliability directly captures the proportion of variance that remains stable across repeated administrations, isolating genetically relevant variation from transient noise. In contrast, our ABCD cognitive measure is a composite factor derived from multiple cognitive tests. For such multi-item composites, McDonald’s is the appropriate reliability index: it estimates the proportion of variance in the composite measure that is attributable to the common latent factor (here, general cognitive ability, or rather than idiosyncratic measurement error associated with individual tests or items.
By contrast, the frequently cited evidence in favor of GxE by Tucker-Drob & Bates (2016) rests on nation-stratified subgroup estimates within the meta-analysis and its U.S.–non-U.S. heterogeneity does not comport with subsequent replication (Figlio et al., 2017). Given that early U.S. reports rested on modest samples, e.g., Turkheimer et al. (2003) inferred Scarr–Rowe moderation from 319 twin pairs at age 7 (114 MZ, 205 DZ), and that detecting small moderation effects typically requires thousands of twin pairs (Hanscombe et al., 2012), the accumulating record suggests Scarr–Rowe-style interactions are not a general feature of cognitive development.
For statistical power reasons, analyses were conducted at the population level (between-family) rather than within-family, meaning these associations may be inflated by factors such as indirect genetic effects (Tan et al., 2024) and cross-trait assortative mating (Border et al., 2022). Therefore, effect sizes should be interpreted with caution and primarily as directional indicators.
The likelihood that our within-family validations in UKB and ABCD are influenced by sample overlap with discovery datasets is minimal. The entire UKB sibling cohort used for validation was explicitly excluded from all discovery analyses, with UKB-based polygenic scores derived solely from non-sibling participants. ABCD served exclusively as an independent validation cohort, contributing no data to any discovery GWAS. Furthermore, any residual overlap from external summary statistics is numerically insignificant and incapable of generating the robust within-family effects observed, which depend solely on Mendelian segregation. The replication of within-family slopes in two independent cohorts further reduces any plausible concern about sample overlap influencing our results.
Here, “hierarchical” refers to a staged integration strategy in which trait inputs are grouped and combined according to their relationship to the focal phenotype (e.g., cognition-related and genetically correlated auxiliary traits), rather than being treated as a single undifferentiated pool.
UK Biobank participation is non-random; participation probabilities increase with education/cognition and related traits, and participation itself has genetic correlates. Conditioning on inclusion (especially when restricting to complete sibling pairs) creates a collider: within included families, for a given within-family PGS difference, the lower-PGS sibling must on average have a more favorable residual in cognition to be observed. In the differenced fixed-effects equation, this induces (an index-event/volunteer-selection mechanism), biasing the within-family slope toward downward. Under monotone selection on cognition/residuals this attenuation is the default expectation in UKB-type samples with a “healthy volunteer bias”. Under these conditions, the reported within-family coefficient can be interpreted as conservative with respect to the direct genetic association.