Introduction
Spearman’s Hypothesis (SH; Jensen, 1980) refers to the empirical tendency for (socially identified) White-Black[1] (W-B) differences in cognitive test performance to be more pronounced on subtests that are more highly saturated with the general factor of intelligence, or g (Spearman, 1927, pp. 379–380). In its standard operational form, the hypothesis has most commonly been tested using Jensen’s (1985, 1998) method of correlated vectors (MCV), in which a vector of subtest g-loadings is correlated with a vector of standardized group differences (often Cohen’s d statistics) across the same subtests. A positive vector correlation suggests that g can be said to moderate the group difference, whereas a weak, null, or negative vector correlation indicates attenuation or reversal of the expected SH pattern and is suggestive of the moderating role of non-g sources of ability variance (such as lower-order factors and test specificities).
SH, especially in relation to the results of studies using MCV, has historically been controversial. A major reason for this is the argument that a positively signed vector correlation is not necessarily indicative of a g moderated difference amongst groups. Differences with respect to non-g latent variables (such as group factors) can generate the appearance of g moderated differences in instances where a battery is sufficiently nomologically unbalanced with respect to the sampling of cognitive domains (Ashton & Lee, 2005; Jensen, 1998). Multi-group confirmatory factor analysis (MGCFA) has however repeatedly found that both weak and strong forms of measurement invariance obtain in US W-B differences (with g accounting for between 51% and 100% of the variance in the group difference across studies; Lasker et al., 2021, Table 7, p. 24) which indicates that the straightforward interpretation of SH as demonstrating some non-trivial degree of moderation from g on the group-difference vector is reasonable.
The status of SH is theoretically important because it has been argued that it bears on the potential causes of group differences across cognitive abilities (Jensen, 1998; Rushton & Jensen, 2010; Warne, 2021). The racial hereditarian hypothesis holds that the reason why group differences scale with subtest g loading is because genetic influences (as proxied by inbreeding depression effects and heritabilities) tend also to scale with g loading (Rushton, 1999; Warne, 2021). It has also been hypothesised that as more g-loaded subtests exhibit greater cultural loading, it is the biasing effect of these on the performance of differentially enculturated groups which generates SH (Kan, 2012). More g loaded subtests have also been found to be more sensitive to gene-by-environment interactions involving the suppressing effect of perceived racial and ethnic discrimination on the expressivity of cognitive polygenic scores. In Peñaherrera-Aguirre et al. (2022) it was found specifically that the vector of these clustered positively and significantly with a group-differences vector, g loadings, and a shared environmentality vector. If group differences are instead substantially influenced by narrower cognitive abilities, test-specific sources of variance, measurement error, or environmental perturbations that are not strongly aligned with g (such as those stemming from the non-shared environment), then the vector correlation should be weaker. Thus, variation in the magnitude of the SH vector correlation across studies might, in some instances, provide limited information about causal moderation.
Previous meta-analyses and non-systematic reviews have generally supported SH in US W-B comparisons, with positive vector correlations observed across all cognitive batteries and samples (Jensen, 1985, 1998; te Nijenhuis & van den Hoek, 2016). However, there is also evidence that the direction of the effect is not invariant across contexts. Of relevance are findings from incarcerated and institutionalized (carceral) populations, amongst whom SH appears to be reversed (Woodley of Menie et al., 2025). One possible explanation for this finding is that carceral environments are ecologically harsh, increasing the influence of non-shared environmental variance on cognitive performance. Non-shared environmental effects encompass influences that reduce phenotypic resemblance amongst relatives, and may include health insults, violence, ecological stressors, and other person-specific life-course influences (Plomin, 2024). Precisely in line with this, Woodley of Menie et al. (2025) found that carceral W-B difference vectors cluster positively with vectors of non-shared environmentality, whilst g and culture-loading vectors show the opposite (negative) clustering pattern.
Age is a theoretically important moderator of SH in the context of representative samples. Although the heritability of cognitive ability tends to increase from childhood into early adulthood (this being the Wilson Effect; Bouchard, 2013), evidence from later life suggests that the structure of cognitive variance changes again, as health-related and idiosyncratic environmental influences become more prominent. This manifests as both a decrease in the additive (starting in midlife) and an increase in the non-shared environmental variance components (termed the anti-Wilson Effect; Sarraf et al., 2023, 2025, Fig. 1, p. 2, see also Morris et al., 2025 for similar findings in relation to age-dependent increases in non-shared environmentality amongst younger cohorts). This increase in non-shared environmental variance with age should weaken the organization of group differences around g, causing the vector correlations indexing SH to become attenuated.
The present study
The principal goal of this meta-analysis is to identify as many suitable vector correlation tests of SH as possible for the purpose of generating a meta-analytic point estimate of SH. The primary effect size is the (uncorrected) vector correlation between subtest g-loadings and W-B subtest-level differences. As the relevant sampling unit for these correlations is the number of subtests entering each vector, each effect size is weighted using subtest N, with standard errors (SEs) derived from the reported 95% confidence intervals and inverse variance. A Hedges and Olkin-type random-effects framework is used to estimate the overall magnitude of the vector correlation and the extent of between-study heterogeneity.
The more theoretically meaningful goal is to determine whether sample characteristics moderate the magnitude of these vector correlations. Three moderators are examined: harmonic N (the harmonic mean of the pooled Black and White subsamples), mean age (or midpoint when only a range is given), and study year. Harmonic N is included to account for differences in the effective precision of group comparisons; study year is included to capture possible secular or other trends (such as the Decline Effect); and, as noted previously, sample age tests the hypothesis that the g-dependence of W-B differences attenuates with age, potentially due to the effects of rising non-shared environmental influence on cognitive differences. Critically, evidence for the influence of the latter moderator would indicate that SH is not a fixed property of W-B cognitive-performance differences, as has been suggested most notably by Gordon (1985) who argued on the basis of Tucker’s congruence coefficients (an alternative to MCV) that “[t]he black-white factor is g” (p. 229, italics for emphasis).
Methods
Meta-analytic search
Previous meta-analyses of SH in relation to the US W-B difference have employed restricted criteria for study inclusion. For example, te Nijenhuis and van den Hoek (2016) used the following rules:
The first requirement for a study to be included in the present meta-analysis was having at least four tests or subtests to which the Method of Correlated Vectors could be applied. Second, the samples in the studies should not be selected on a highly g- loaded variable (e.g., referral or gifted samples…). Third, the average age of the participants had to be 18 or older, which means the sample could include some participants younger than 18. (p. 5)
Aspects of these inclusion criteria were replicated in the present work; however certain constraints were lifted and new ones imposed. Firstly, to test for potential age moderation, the requirement that samples be screened out based on mean age <18 years was dropped. Secondly, the requirement for a minimum of four subtests was tightened to five, as subtest number is likely related to the nomological breadth of a given battery, and nomological breadth strongly influences the stability of vector correlations (Jensen, 1998). Thirdly, samples were excluded in cases where they included those exhibiting pathology (such as Alzheimer’s patients). Carceral samples (specifically those who were tested in situ with respect to the prison system) were also excluded from the meta-analysis as incarceration risk is a potentially g loaded variable, and they are therefore non-representative of the broader population (Jensen, 1992). Fourthly, studies that examined Spearman’s Hypothesis using job complexity criteria (such as Roth et al., 2001) were screened out, as were item-level analyses of SH (such as Kirkegaard & Hu, 2025).
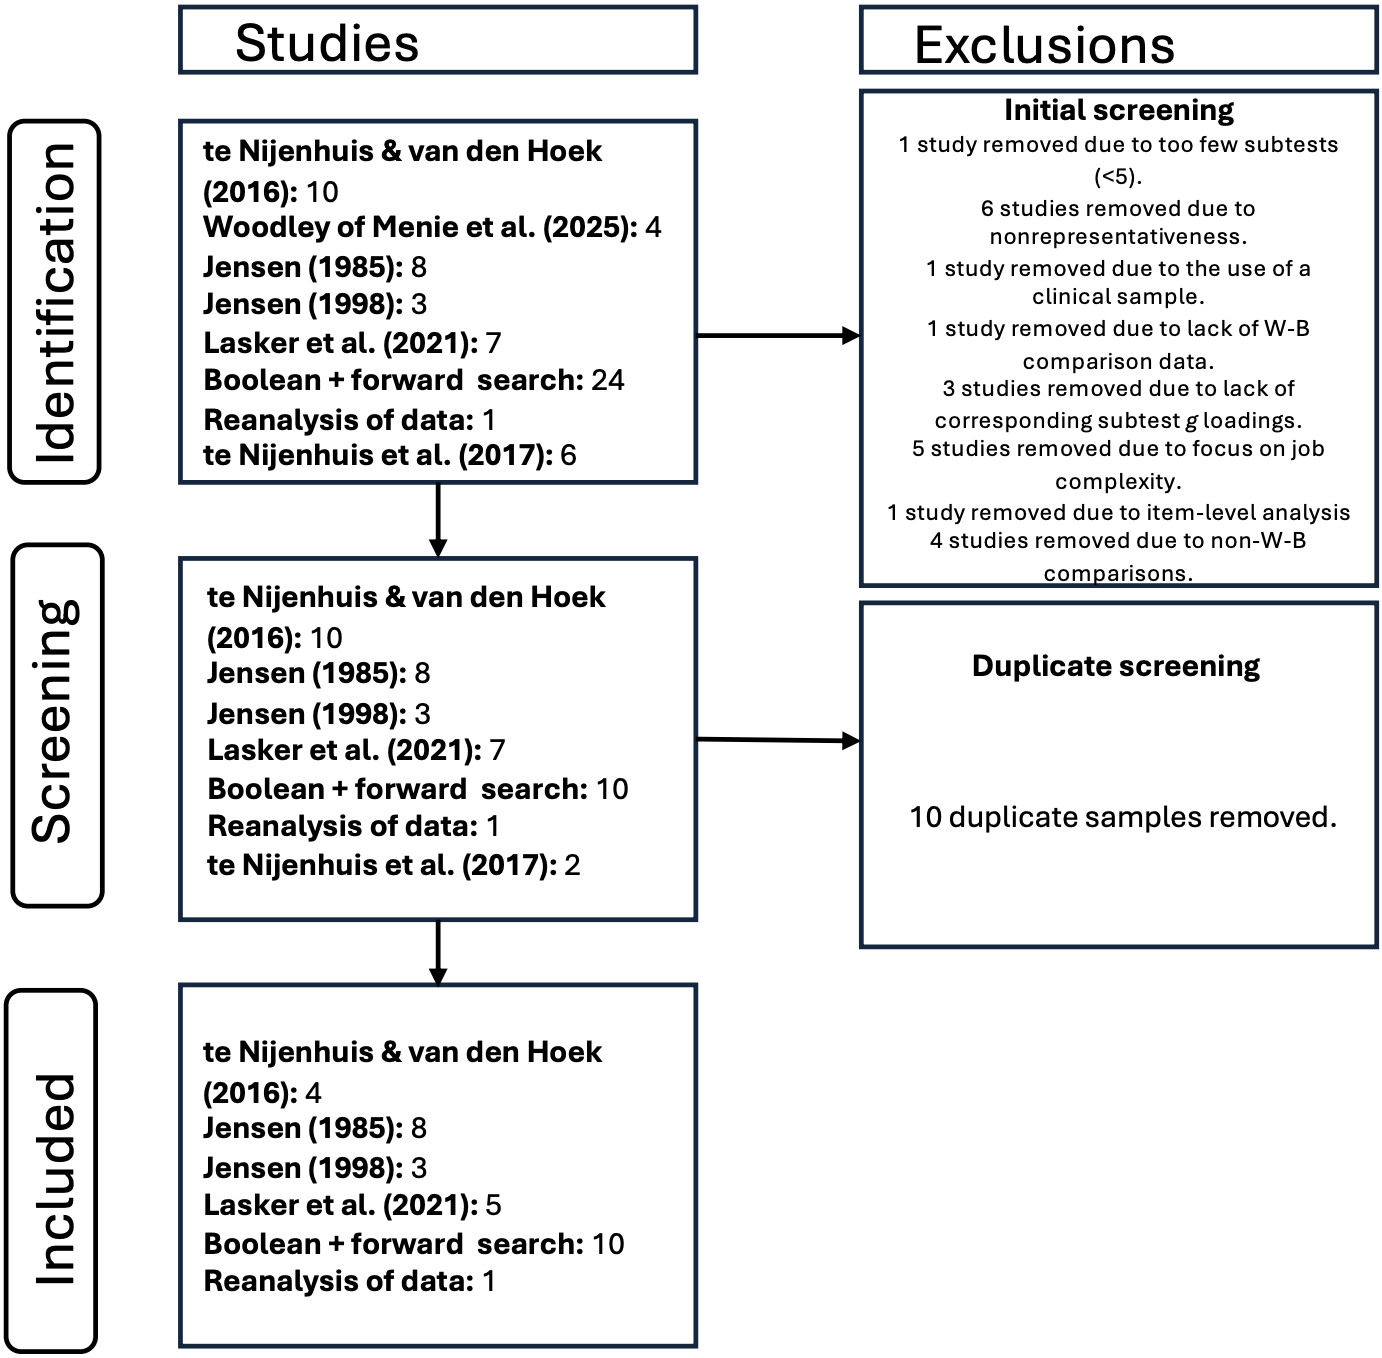
Three meta-analytic studies (te Nijenhuis et al., 2017; te Nijenhuis & van den Hoek, 2016; Woodley of Menie et al., 2025) and three non-systematic reviews (Jensen, 1985, 1998; Lasker et al., 2021) were consulted. As all four studies covered in Woodley of Menie et al. (2025) concerned carceral populations, they were excluded based on being non-representative. In addition, we used a modified form of the Boolean string and reference search criteria employed by te Nijenhuis and van den Hoek (2016), specifically:
[T]he following electronic databases were used: Google Scholar, ProQuest, PsycINFO, and CataloguePlus (Primo). The keywords and phrases used to find further data for the data of Black adults were: “Black adult(s)”, “Black and White adults”, “Negro adults”, “Spearman’s hypothesis adults”, “Spearman’s hypothesis Black”, “Spearman’s hypothesis Negro”, and “Spearman’s hypothesis workforce”. These keywords were combined with the following keywords: “intelligence”, “IQ”, “mental ability”, “mental capacity”, “cognitive ability”, “aptitude”, “competence”, “differences”, “WAIS” (Wechsler Adult Intelligence Scale), “KAIT” (Kaufman Adult Intelligence Test), and “Woodcock Johnson”. To supplement the data we found, we searched the references of the studies already obtained to find other studies with potential data. (p. 5)
This was supplemented with additional strings corresponding to “Black children”, “Black and White children”, “Negro children”, “Spearman’s hypothesis children”. As with te Nijenhuis and van den Hoek (2016) studies were only selected for screening if they concerned US-based individuals. The searches were conducted twice by the lead author. Firstly, at the inception of the research phase of the study in February 2025, and again in June 2026 at the closing out of the study. For the second round of searches, assistance was provided by the third author. No formal protocol was registered.
Several studies reported data on overlapping samples (for example, multiple studies have examined SH in relation to the various Woodcock-Johnson normalisation samples, the Armed Services Vocational Aptitude Battery [ASVAB] in the National Longitudinal Survey of Youth [NLSY] '79 cohort, Project Talent etc). In these cases, either the most recent study, or the one with the largest sample size and/or subtest number was retained.
The search was enhanced with three additional measures aimed at further increasing the pool of usable effect sizes. Firstly, studies reporting data based on scholastic attainment criteria (such as the correlations between Advanced Placement examination performance and a measure of g) were admitted into the meta-analysis, as were studies employing g loadings derived from the common factor amongst elementary cognitive task groupings. This yielded an additional two studies and four effect sizes (Jensen, 1993; Warne, 2016). Secondly, studies were retained in which, via reanalysis of raw data, new tests of SH could be conducted. This netted four additional effect sizes (MIDUS-II and MIDUS Refresher with the Milwaukee African American sample; Woodley of Menie et al., 2015, and two further effect sizes from Osborne’s [1980] study). A further nine usable studies were identified based on the search (Blankson & McArdle, 2015; Dalliard, 2013; Fuerst et al., 2023; Hu, 2025; Kane, 2004, 2007; Kane & Brand, 2008; National Academy of Sciences [NAS], 1921; Shibaev & Fuerst, 2026).
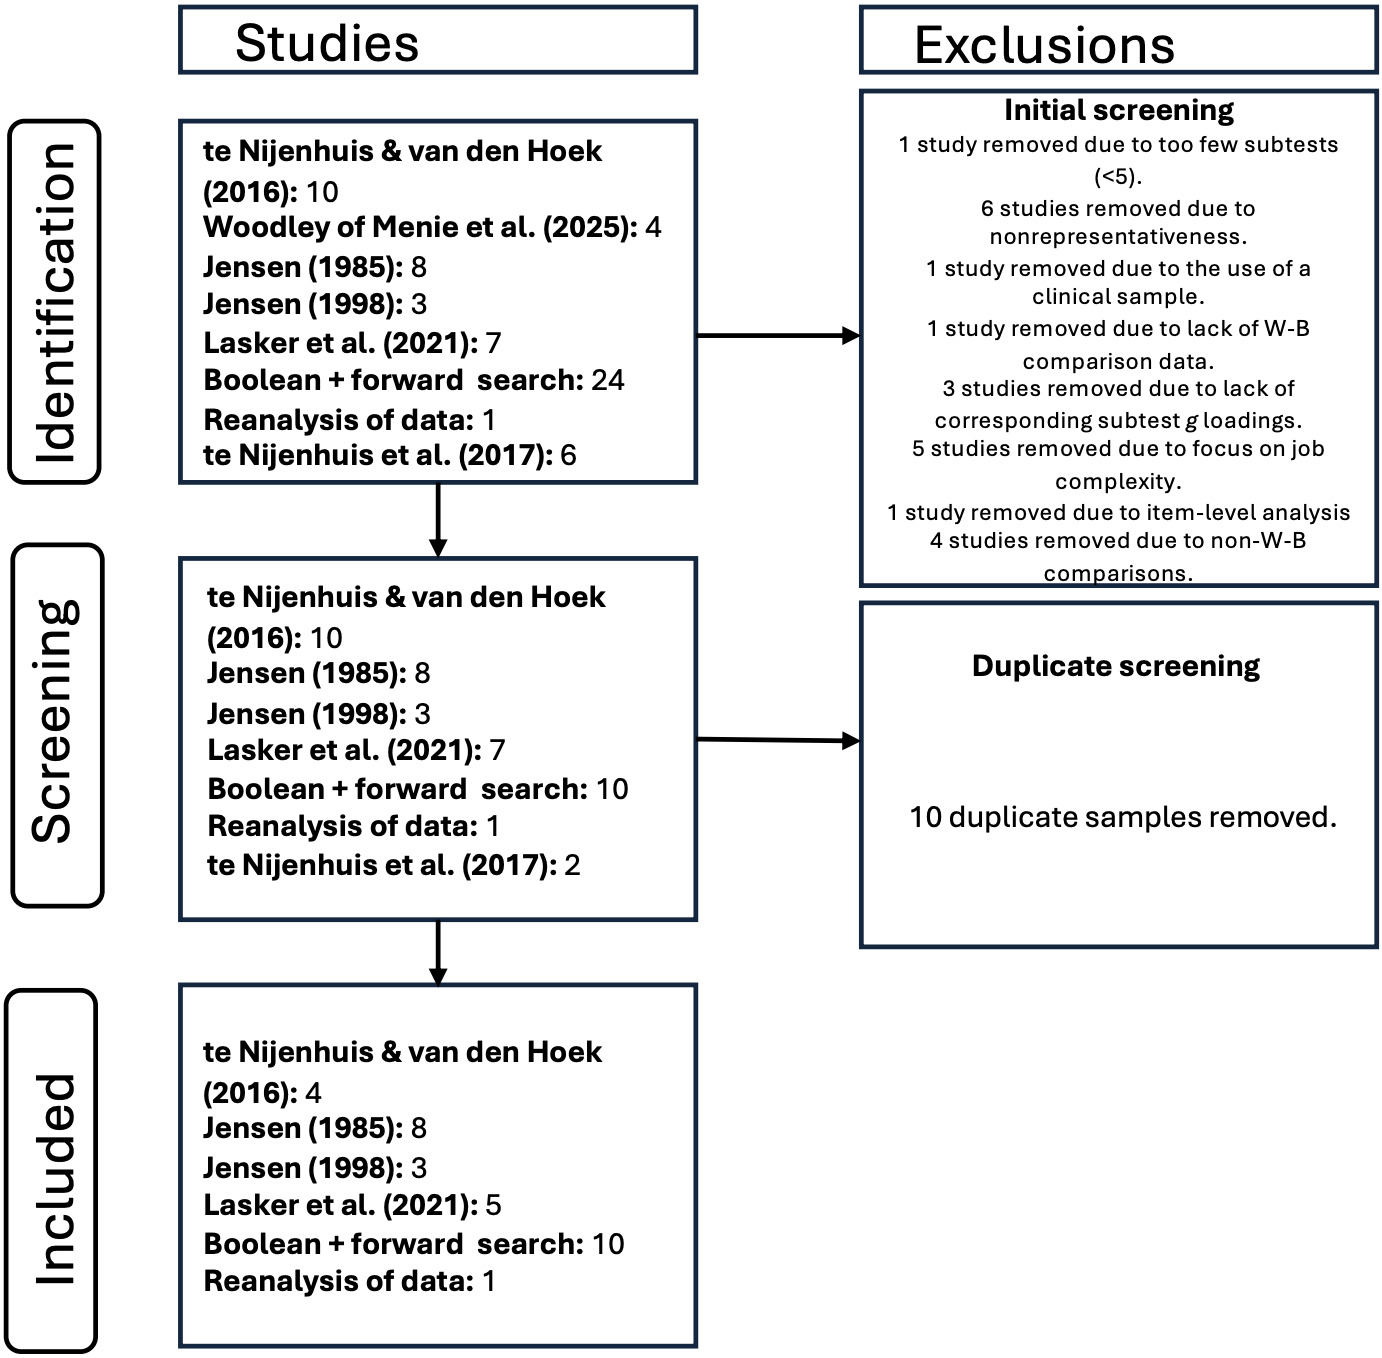
These studies were combined with the four studies retained from te Nijenhuis and van den Hoek (2016; Carretta, 1997; Hennessy & Merrifield, 1976; Kaufman et al., 1988; Sternberg & The Rainbow Project Collaborators, 2006), the eight studies retained from Jensen (1985; National Center for Education Statistics, 1972, Kaufman & Kaufman, 1983; Mercer, 1984; Nichols, 1972; Osborne, 1980; Reynolds & Gutkin, 1981; Scarr, 1981; Veroff & McClelland, 1971), the two additional studies retained from Jensen (1998, Naglieri & Jensen, 1987; Peoples et al., 1995), and the five studies retained from Lasker et al. (2021, Frisby & Beaujean, 2015; Hu, 2017; Hu et al., 2019; Lasker et al., 2019). The total yield was of 31 studies comprising 44 independent effect sizes.
Figure 1 presents a PRISMA-style flow chart illustrating how the initial pool of studies was reduced to the final sample.
Meta-analytic methods
Two meta-analytic strategies were employed. Firstly, the Hedges and Olkin approach was used to estimate the meta-analytic effect sizes and between-study heterogeneity (I2). Studies were weighted based on inverse variance using SEs derived from their subtest numbers, and a random effects model was estimated. Three moderators were employed; harmonic mean of sample size, defined as where nw and nb correspond to the individual White and Black group sizes respectively (Klockars & Sax, 1987). This allowed for any additional precision-related influences associated with differences in sample size, net of variation in subtest number to be examined. Mean (or midpoint) sample ages were sourced from the studies or were inferred based on additional criteria. As noted in the Introduction, age is a prospectively important moderator because it potentially captures rising non-shared environmentality which should weaken SH. Consequently, a very broad range of ages were considered in this study, with the youngest sample having a mean age of just three (Peoples et al., 1995) and the oldest 76 years (Shibaev & Fuerst, 2026), yielding a span of 73 years. Finally, study year was also included to test for the possibility of secular trends or so-called Decline Effects (decreases in effect sizes over time) perhaps reflecting selective reporting early in the research paradigm (e.g., Schooler, 2011). The oldest study from which an estimate of SH could be obtained was Robert Yerkes’ (1876-1956) Army Alpha and Beta validation (NAS, 1921); the most recent was from 2026 (Shibaev & Fuerst, 2026), yielding a span of 105 publication years. Funnel asymmetry was examined using Fisher’s r-to-z transformed vector correlations. Egger’s regressions were estimated before and after adjustment for the three moderators. Duval and Tweedie’s (2000) trim-and-fill procedure was used to evaluate whether asymmetry suggested missing effect sizes.
Secondly, sampling error was also estimated using a bare-bones meta-analytic approach. Sampling error estimates allow for the degree to which between-study variance might be substantive, i.e. due to the action of potential moderators (Schmidt & Hunter, 2015).
Software
All analyses were conducted in Python 3.13.5 using NumPy (Harris et al., 2020), pandas (McKinney, 2010), SciPy (Virtanen et al., 2020), and Matplotlib (Hunter, 2007). Excel input/output was handled using pandas with openpyxl/XlsxWriter. Custom Python functions, generated with GPT 5.5, were used to estimate restricted maximum likelihood random-effects meta-regression models, Egger’s regressions, and trim-and-fill diagnostics. All code used in this analysis is included in the first Supplement (S1). All data are included as an Excel spreadsheet in the second Supplement (S2).
Results
Meta-analysis
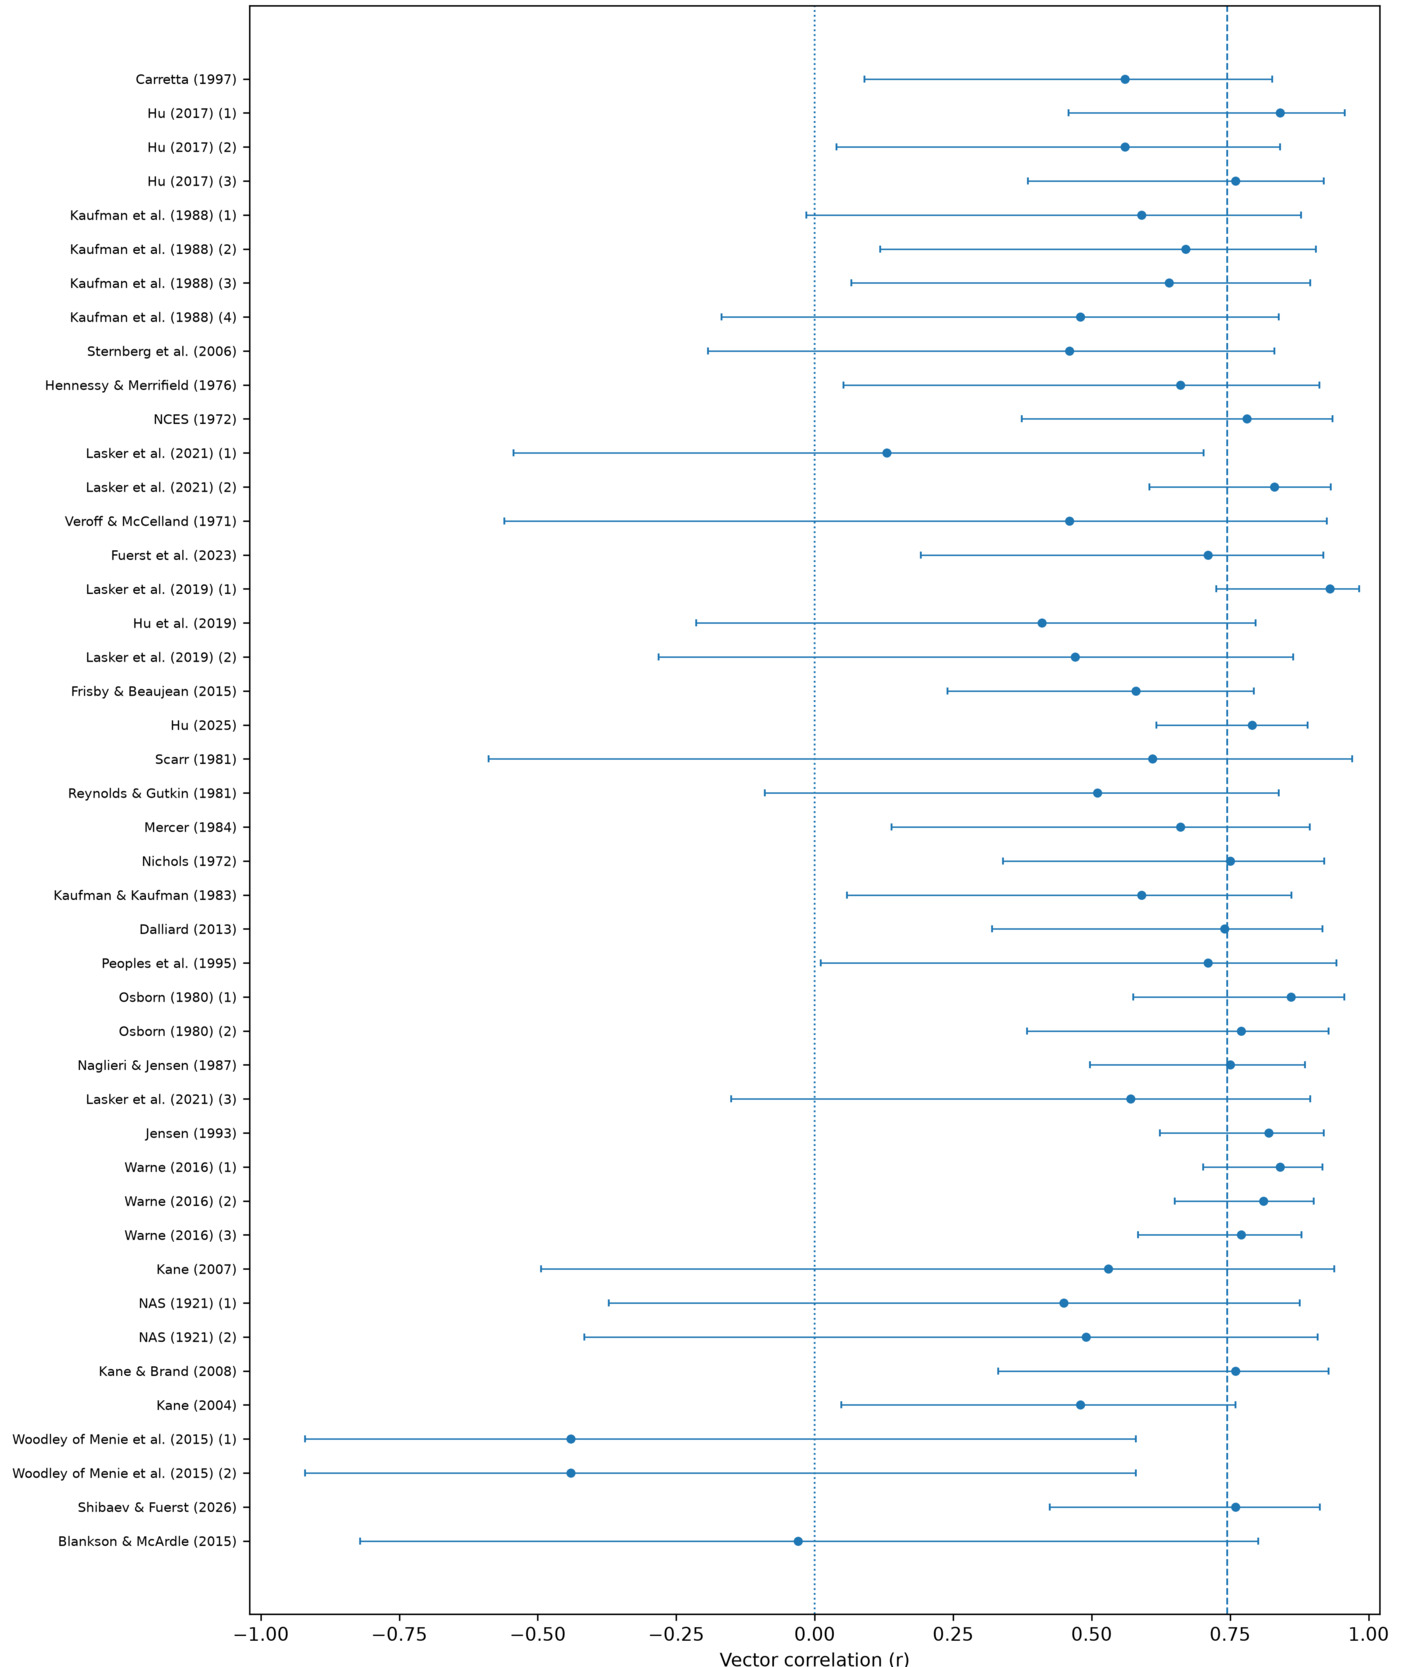
The study effect sizes are presented in the forest plot depicted in Figure 2.
.png)
The results of the random effects meta-analysis are reported in Table 1.
The aggregate effect size is .745, 95% CI [.699, .792]. This is of large magnitude (r≥.50, Cohen, 1988). Heterogeneity fell into the moderate range based on conventional guidelines, I2 = 25.61%, 95% CI [0.00%, 50.5%], although the confidence interval spans values consistent with relatively low to substantial heterogeneity (Deeks et al., 2024). The prediction interval ranged from .628 to .862. The results of the moderator analysis are presented in Table 2.
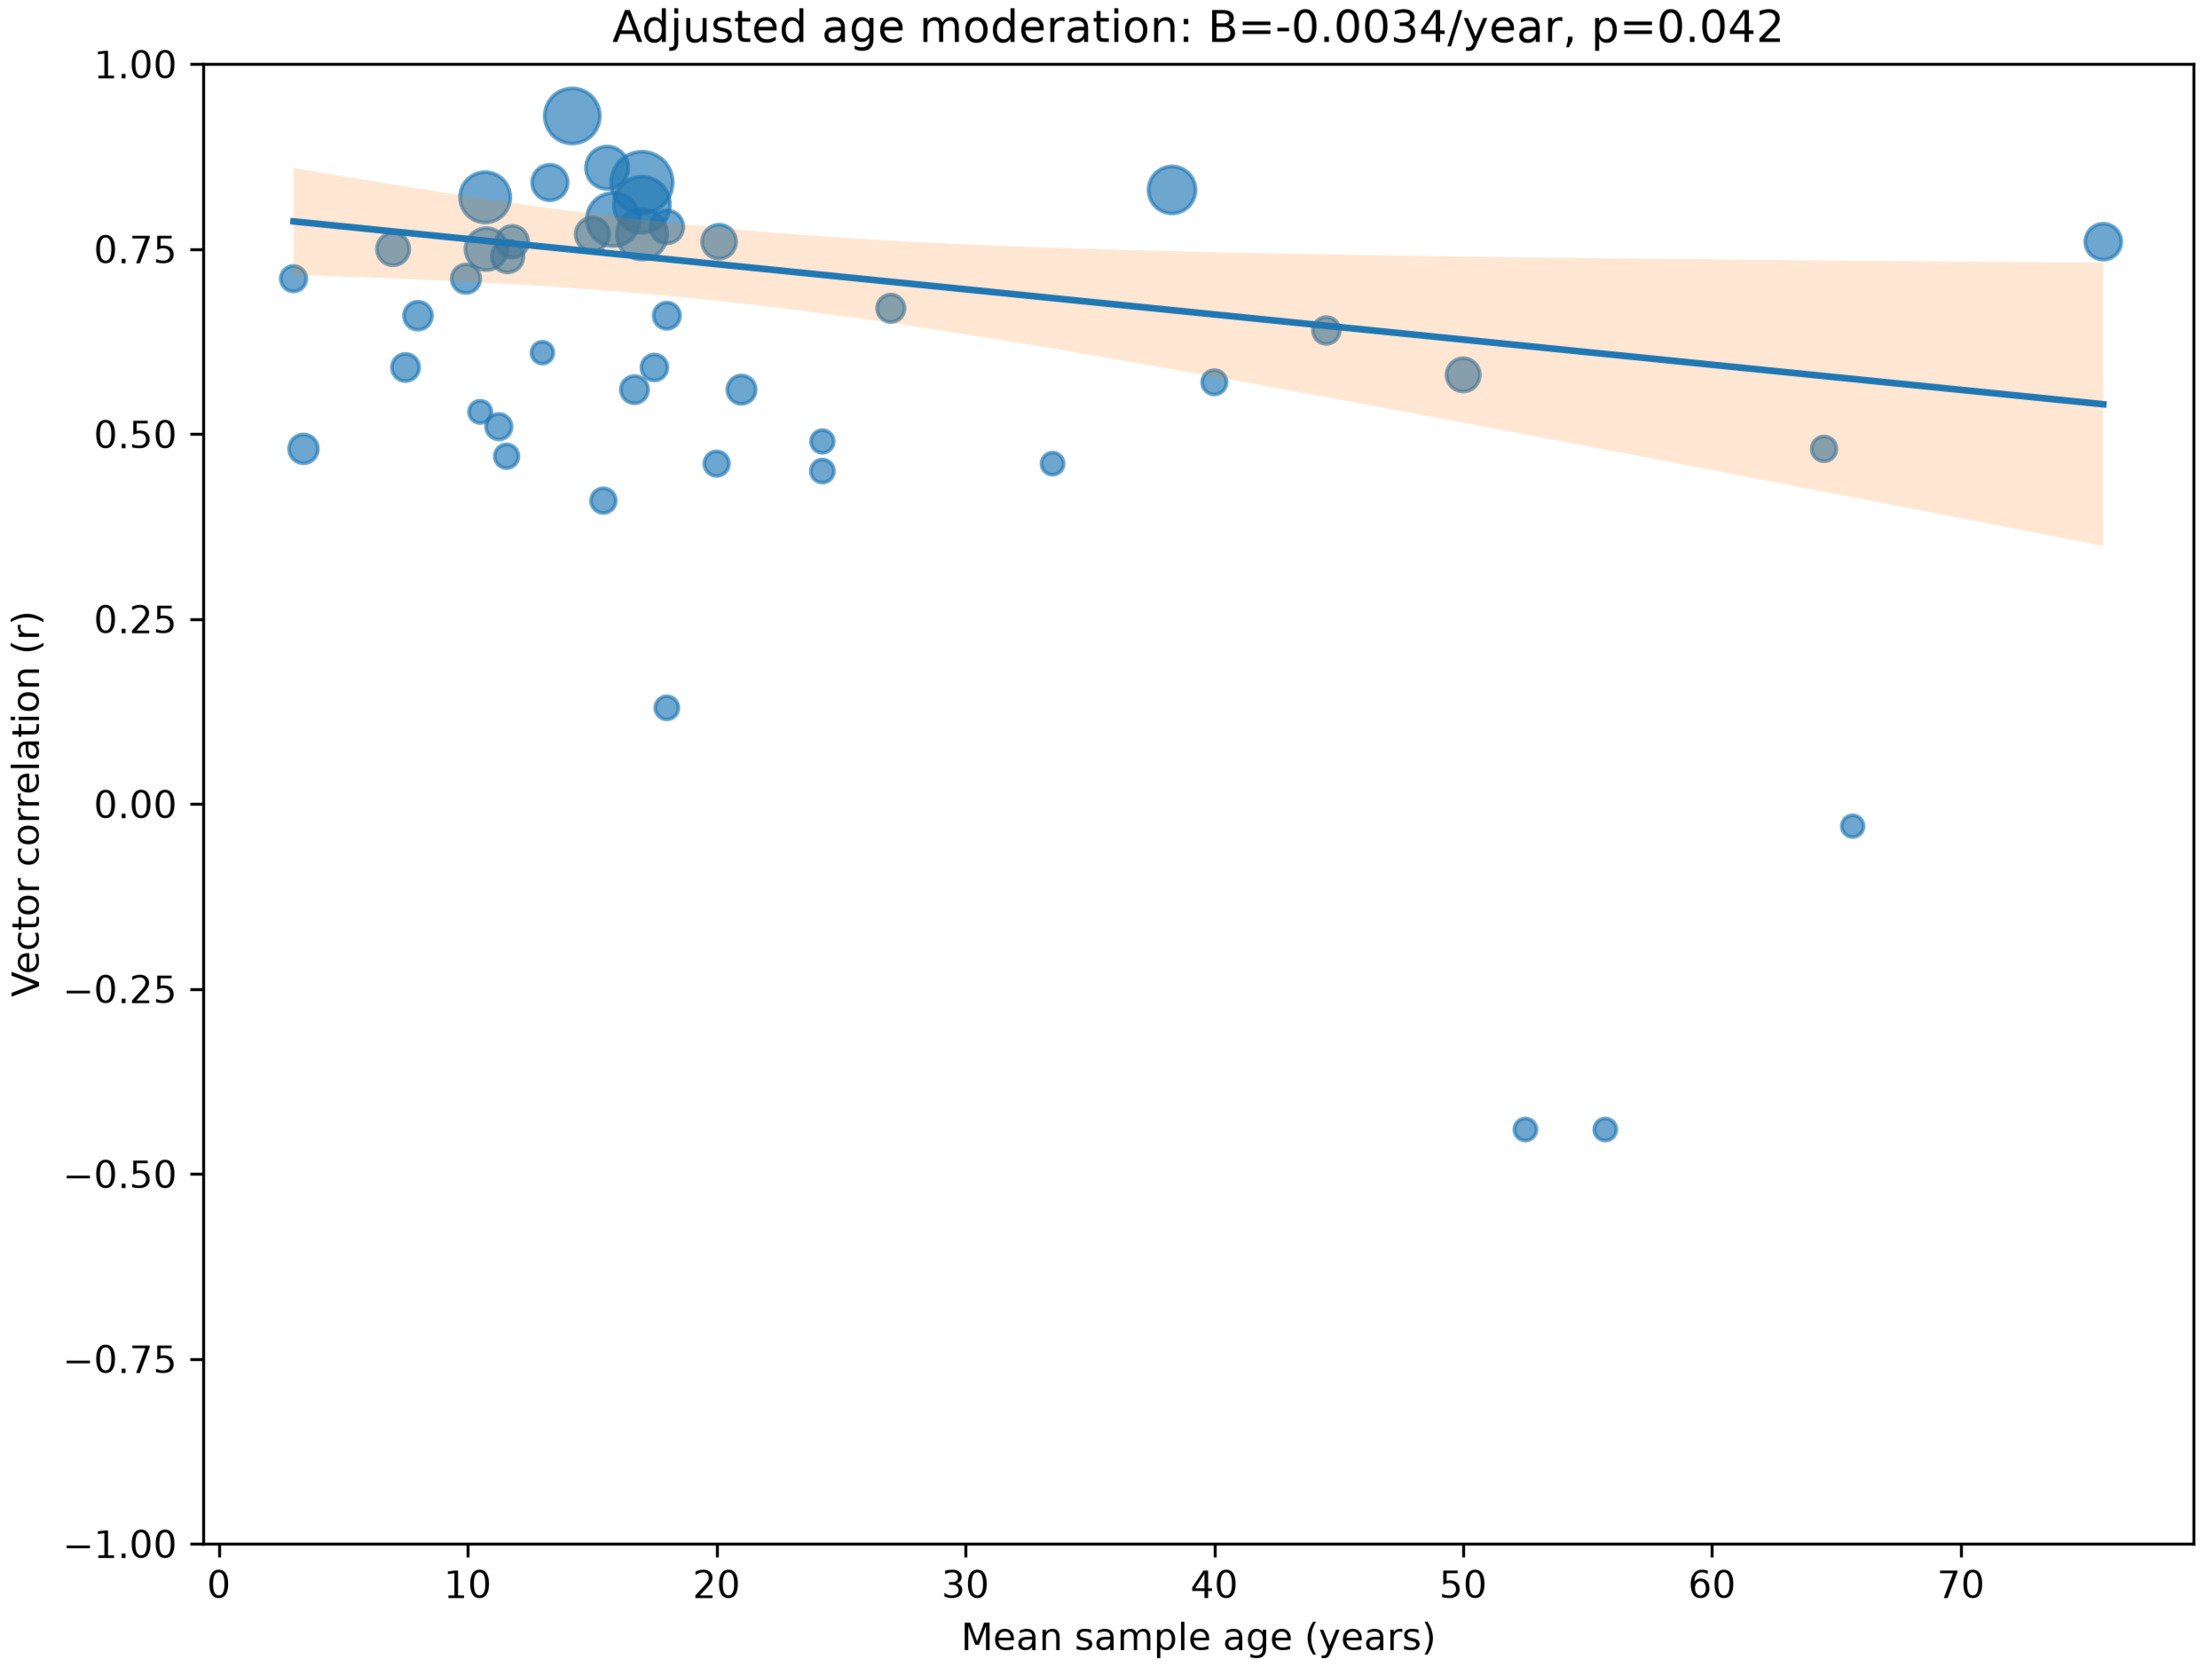
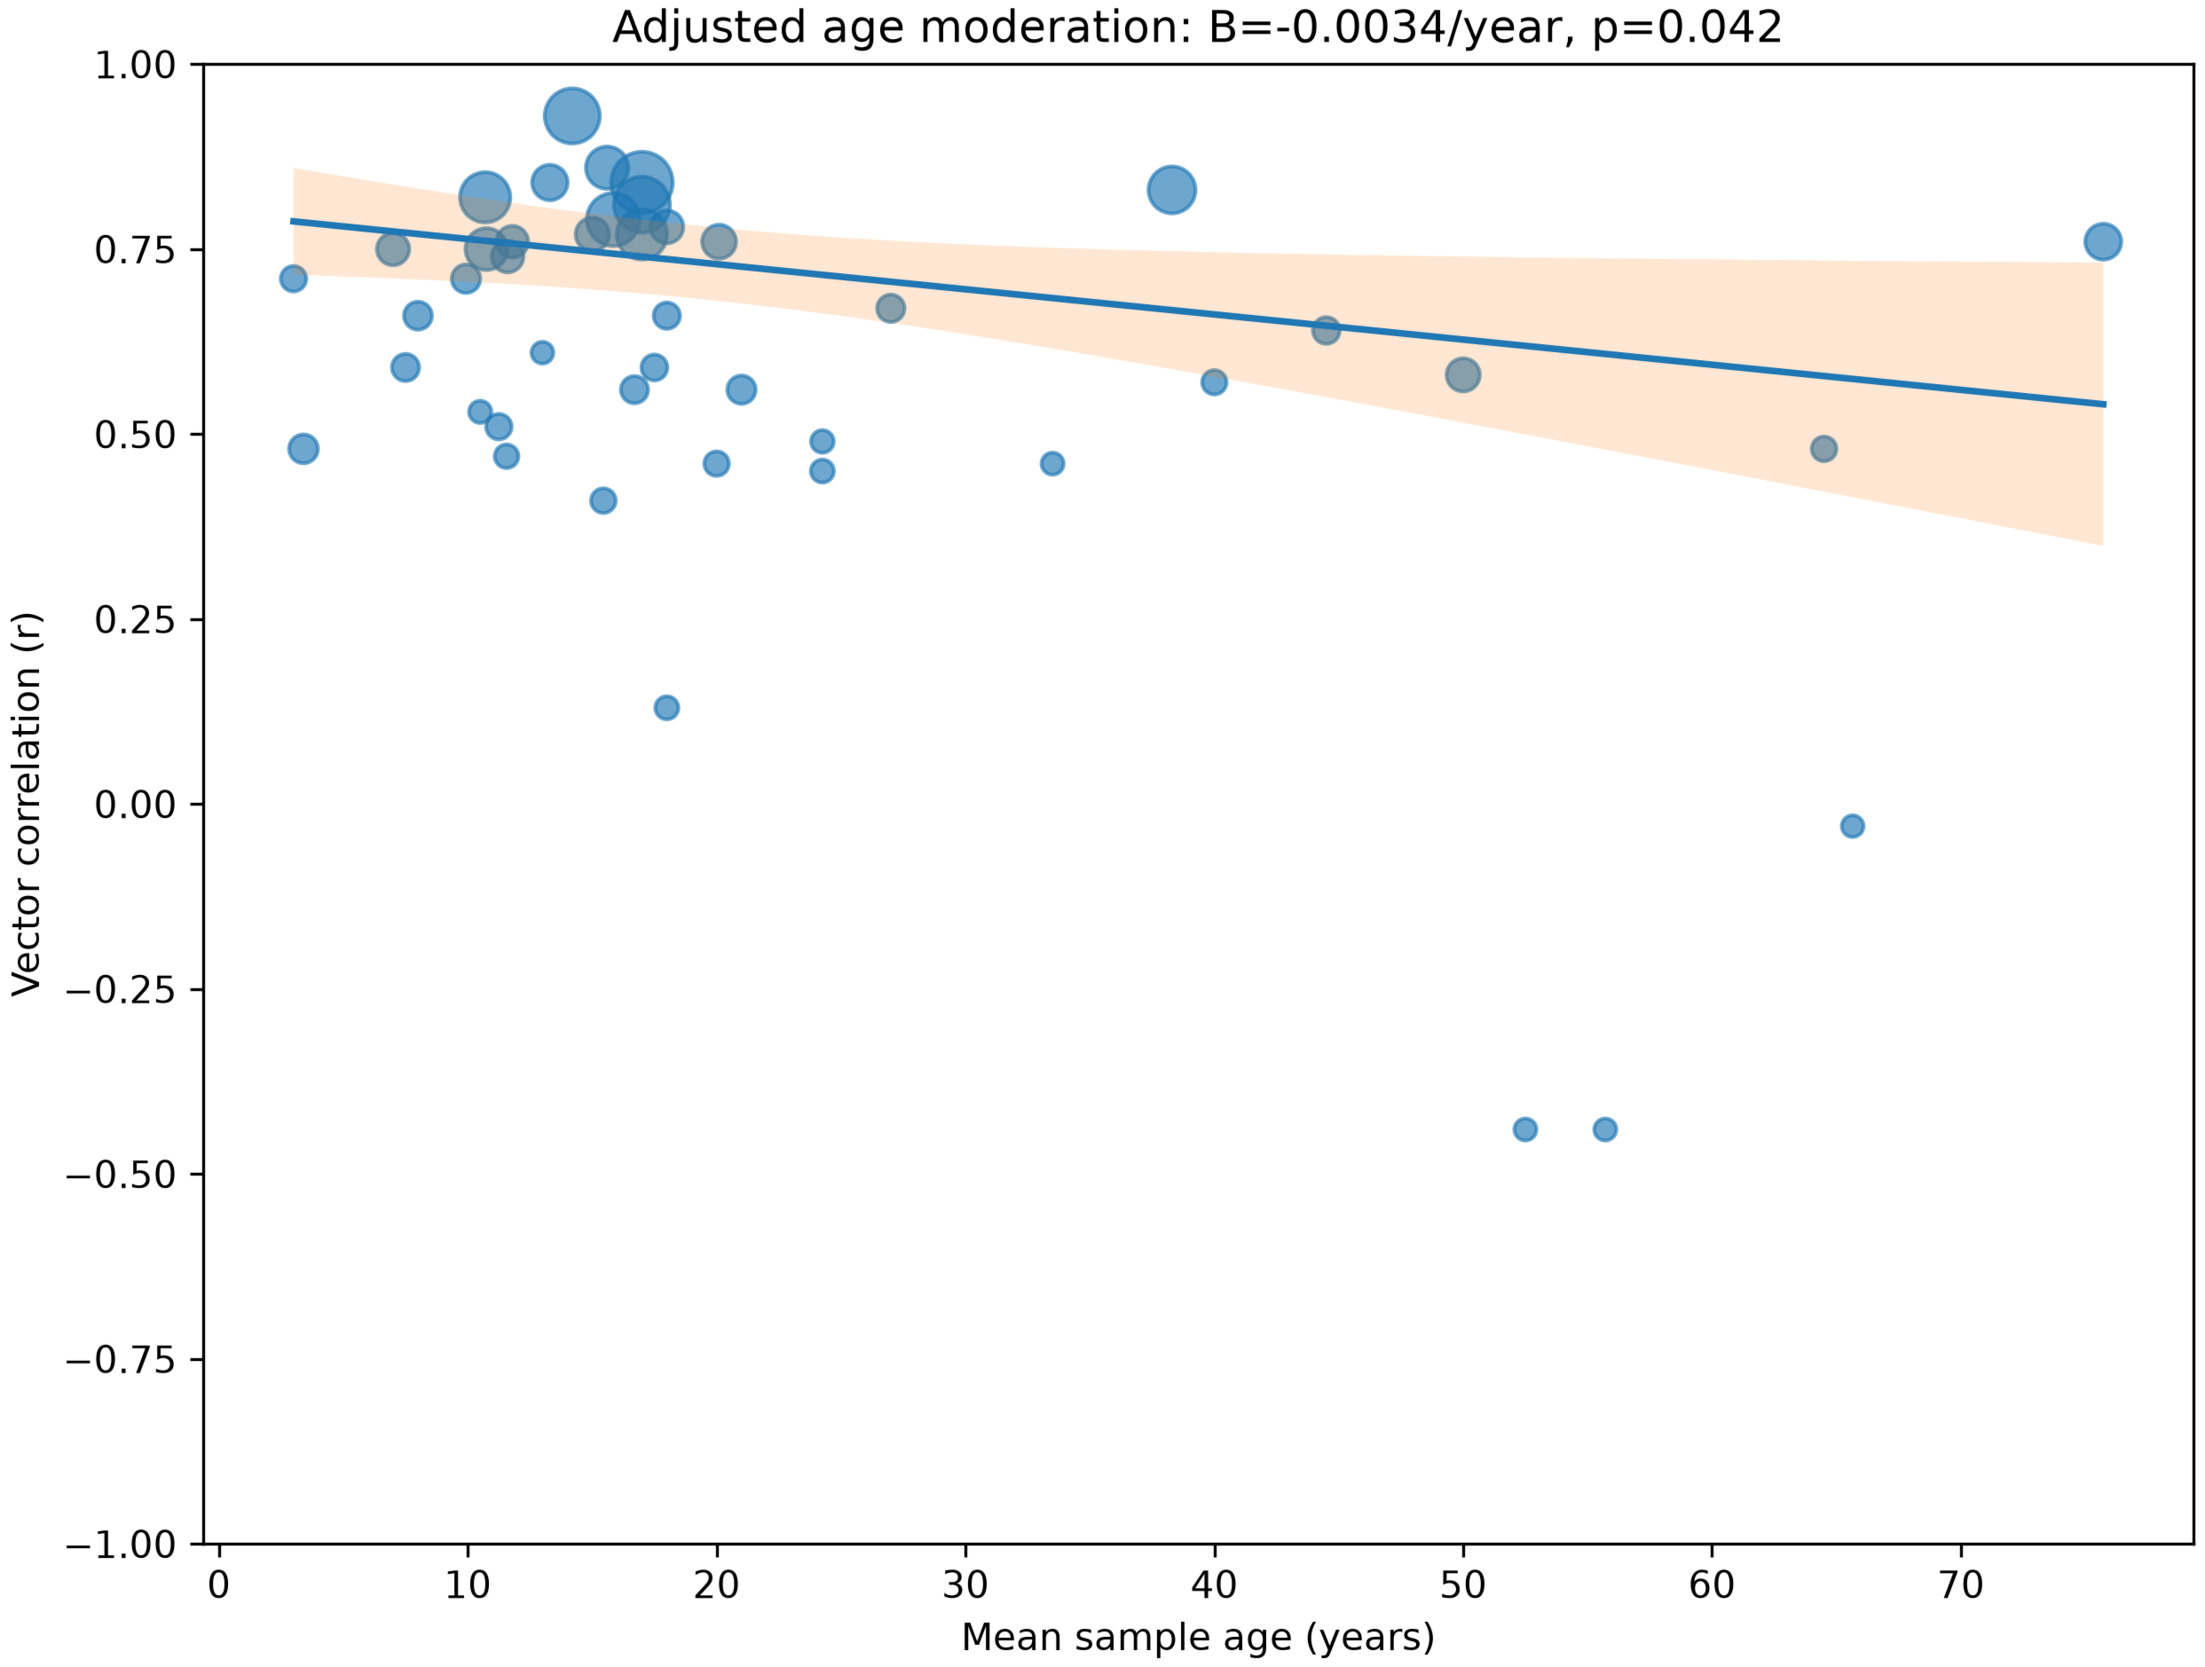
Moderator collinearity was low, with variance inflation factors ranging from 1.043 to 1.079 (values <5 are considered indicative of negligible collinearity; Menard, 1995). A leave-one-out (LOO) analysis was conducted on the age moderator. The coefficient remained negative after every iteration (involving the removal of one of the 31 studies) and was significant 21 out of 31 iterations, with B values ranging from -.006 to -.002 per year, and an average LOO p≈.051.
A quadratic analysis was also conducted on age to check for non-linear moderation; however, the results were non-significant (F(1,41)=.002, p=.962, ΔAIC = +1.98).
The age moderation effect is graphed in Figure 3.
Next, Schmidt and Hunter’s (2015) bare-bones meta-analytic sampling error was estimated. The results are presented in Table 3.
Only one of these estimates exceeds the 75% rule-of-thumb threshold (Schmidt et al., 1988) indicating that variability amongst the vector correlations likely reflects meaningful residual variance and is therefore more than just sampling error, consistent with the action of potential age moderation.
Publication bias
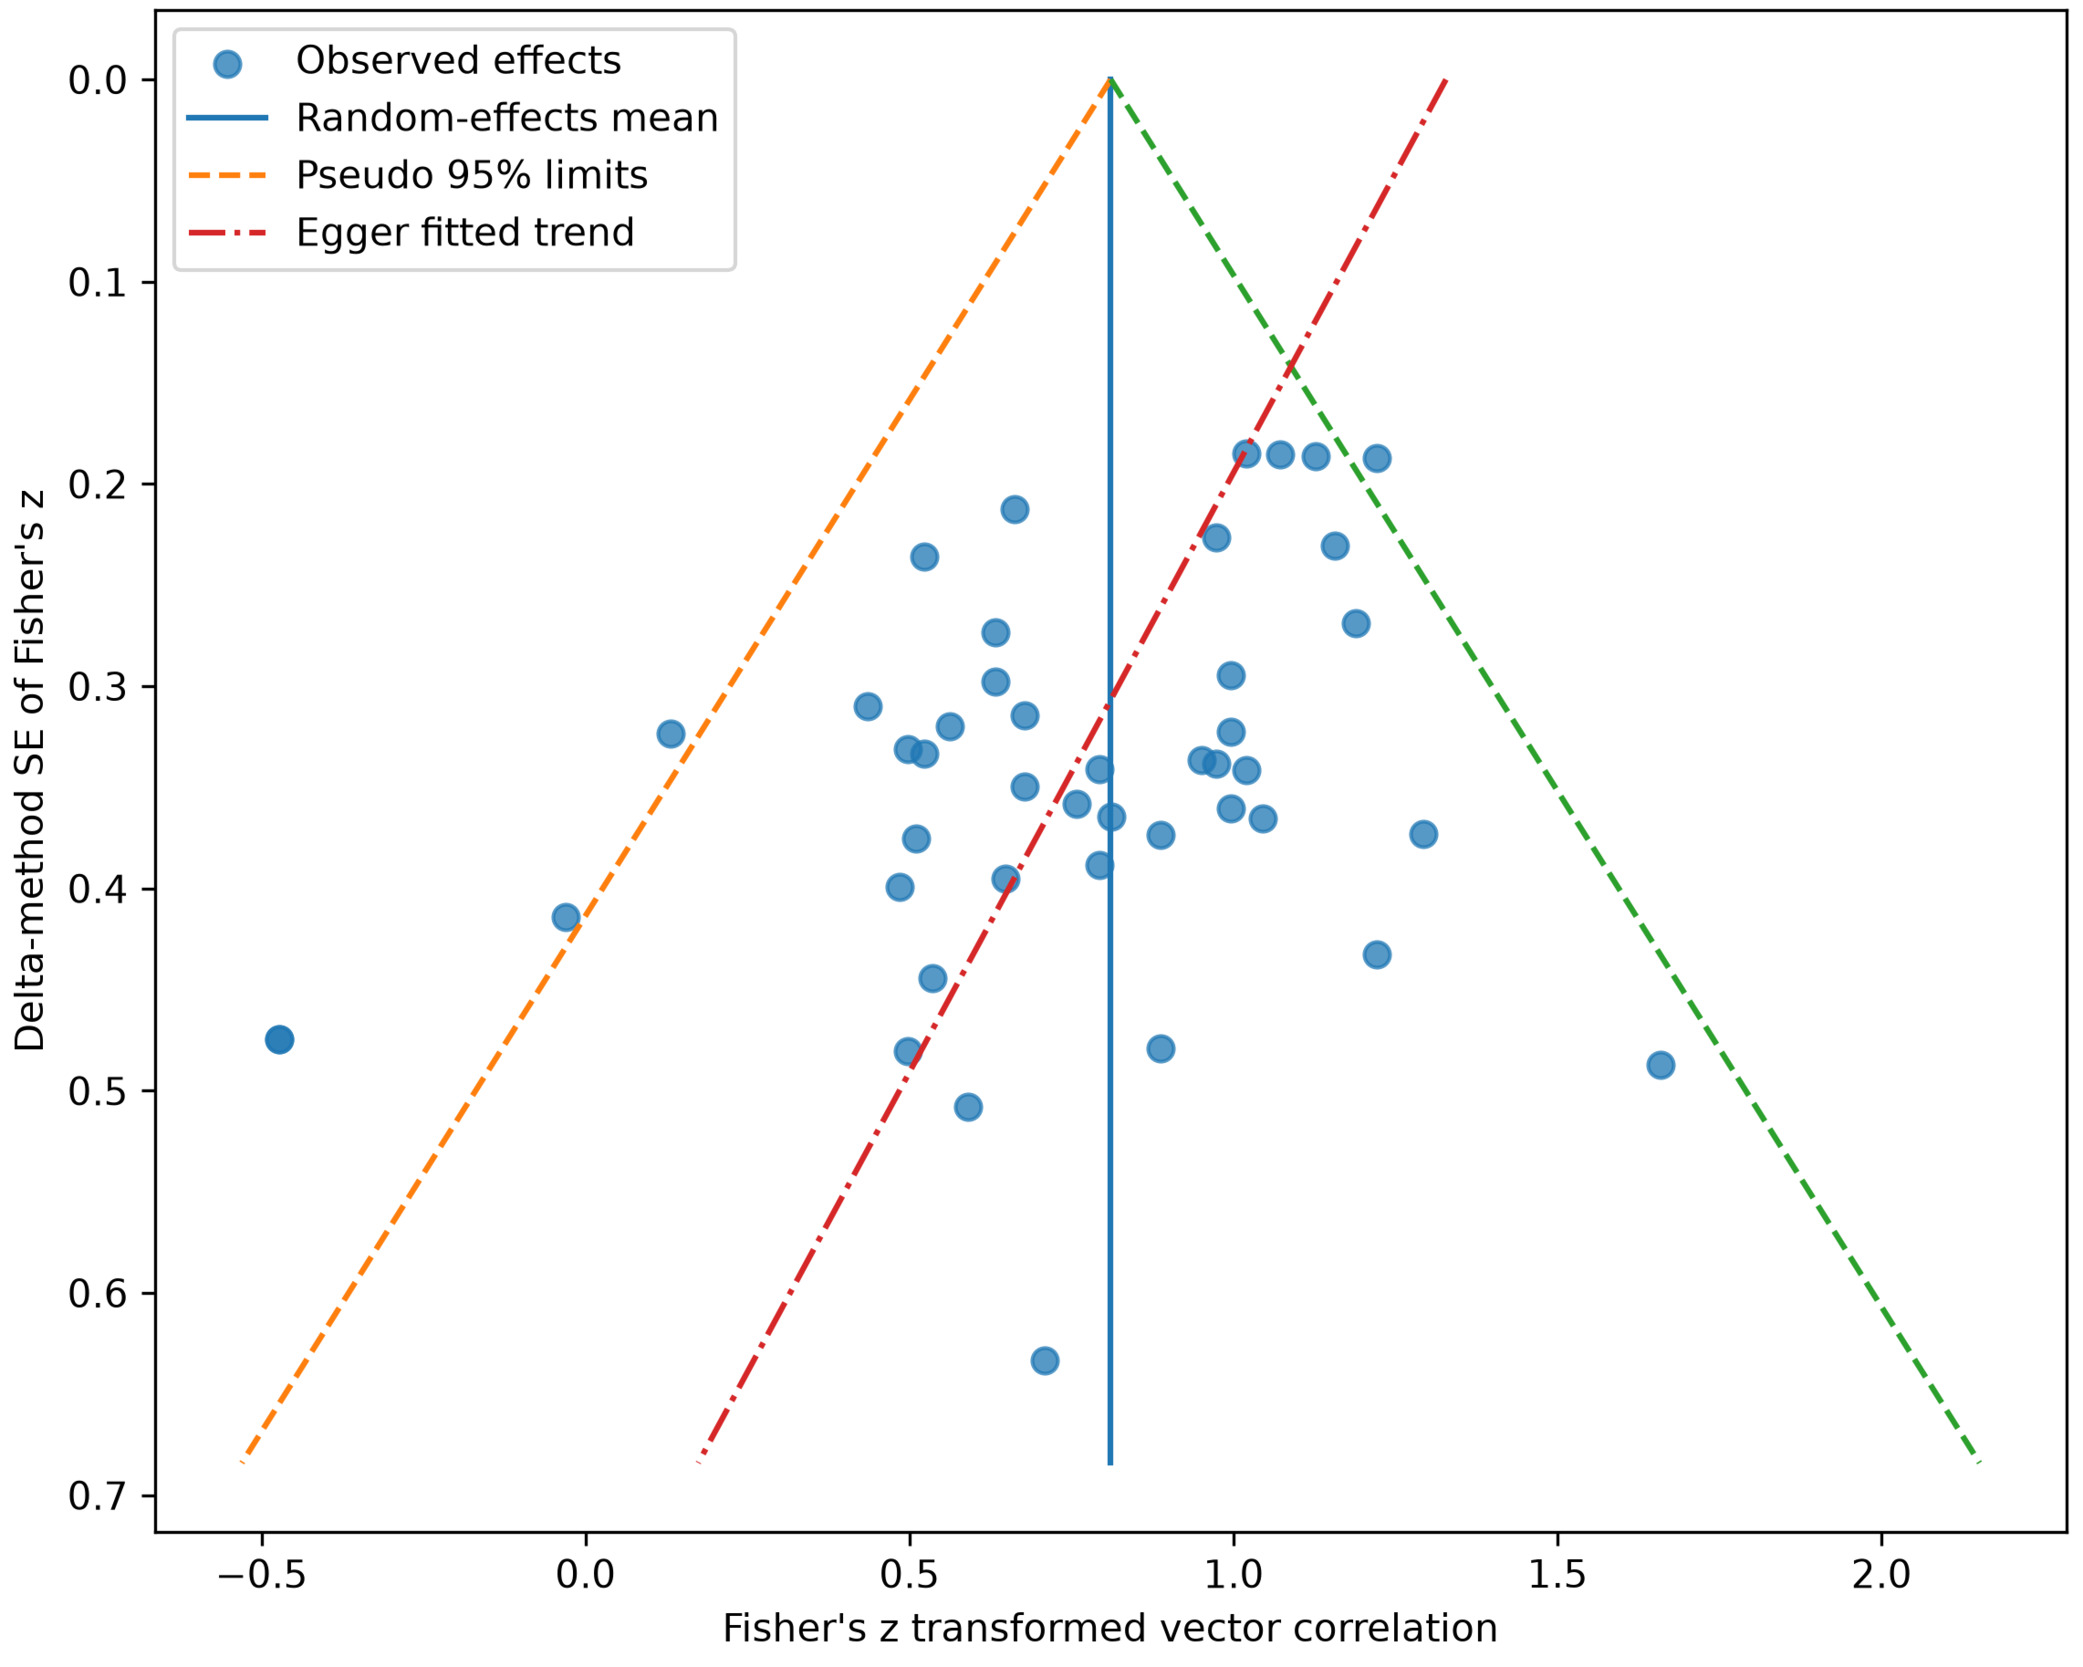
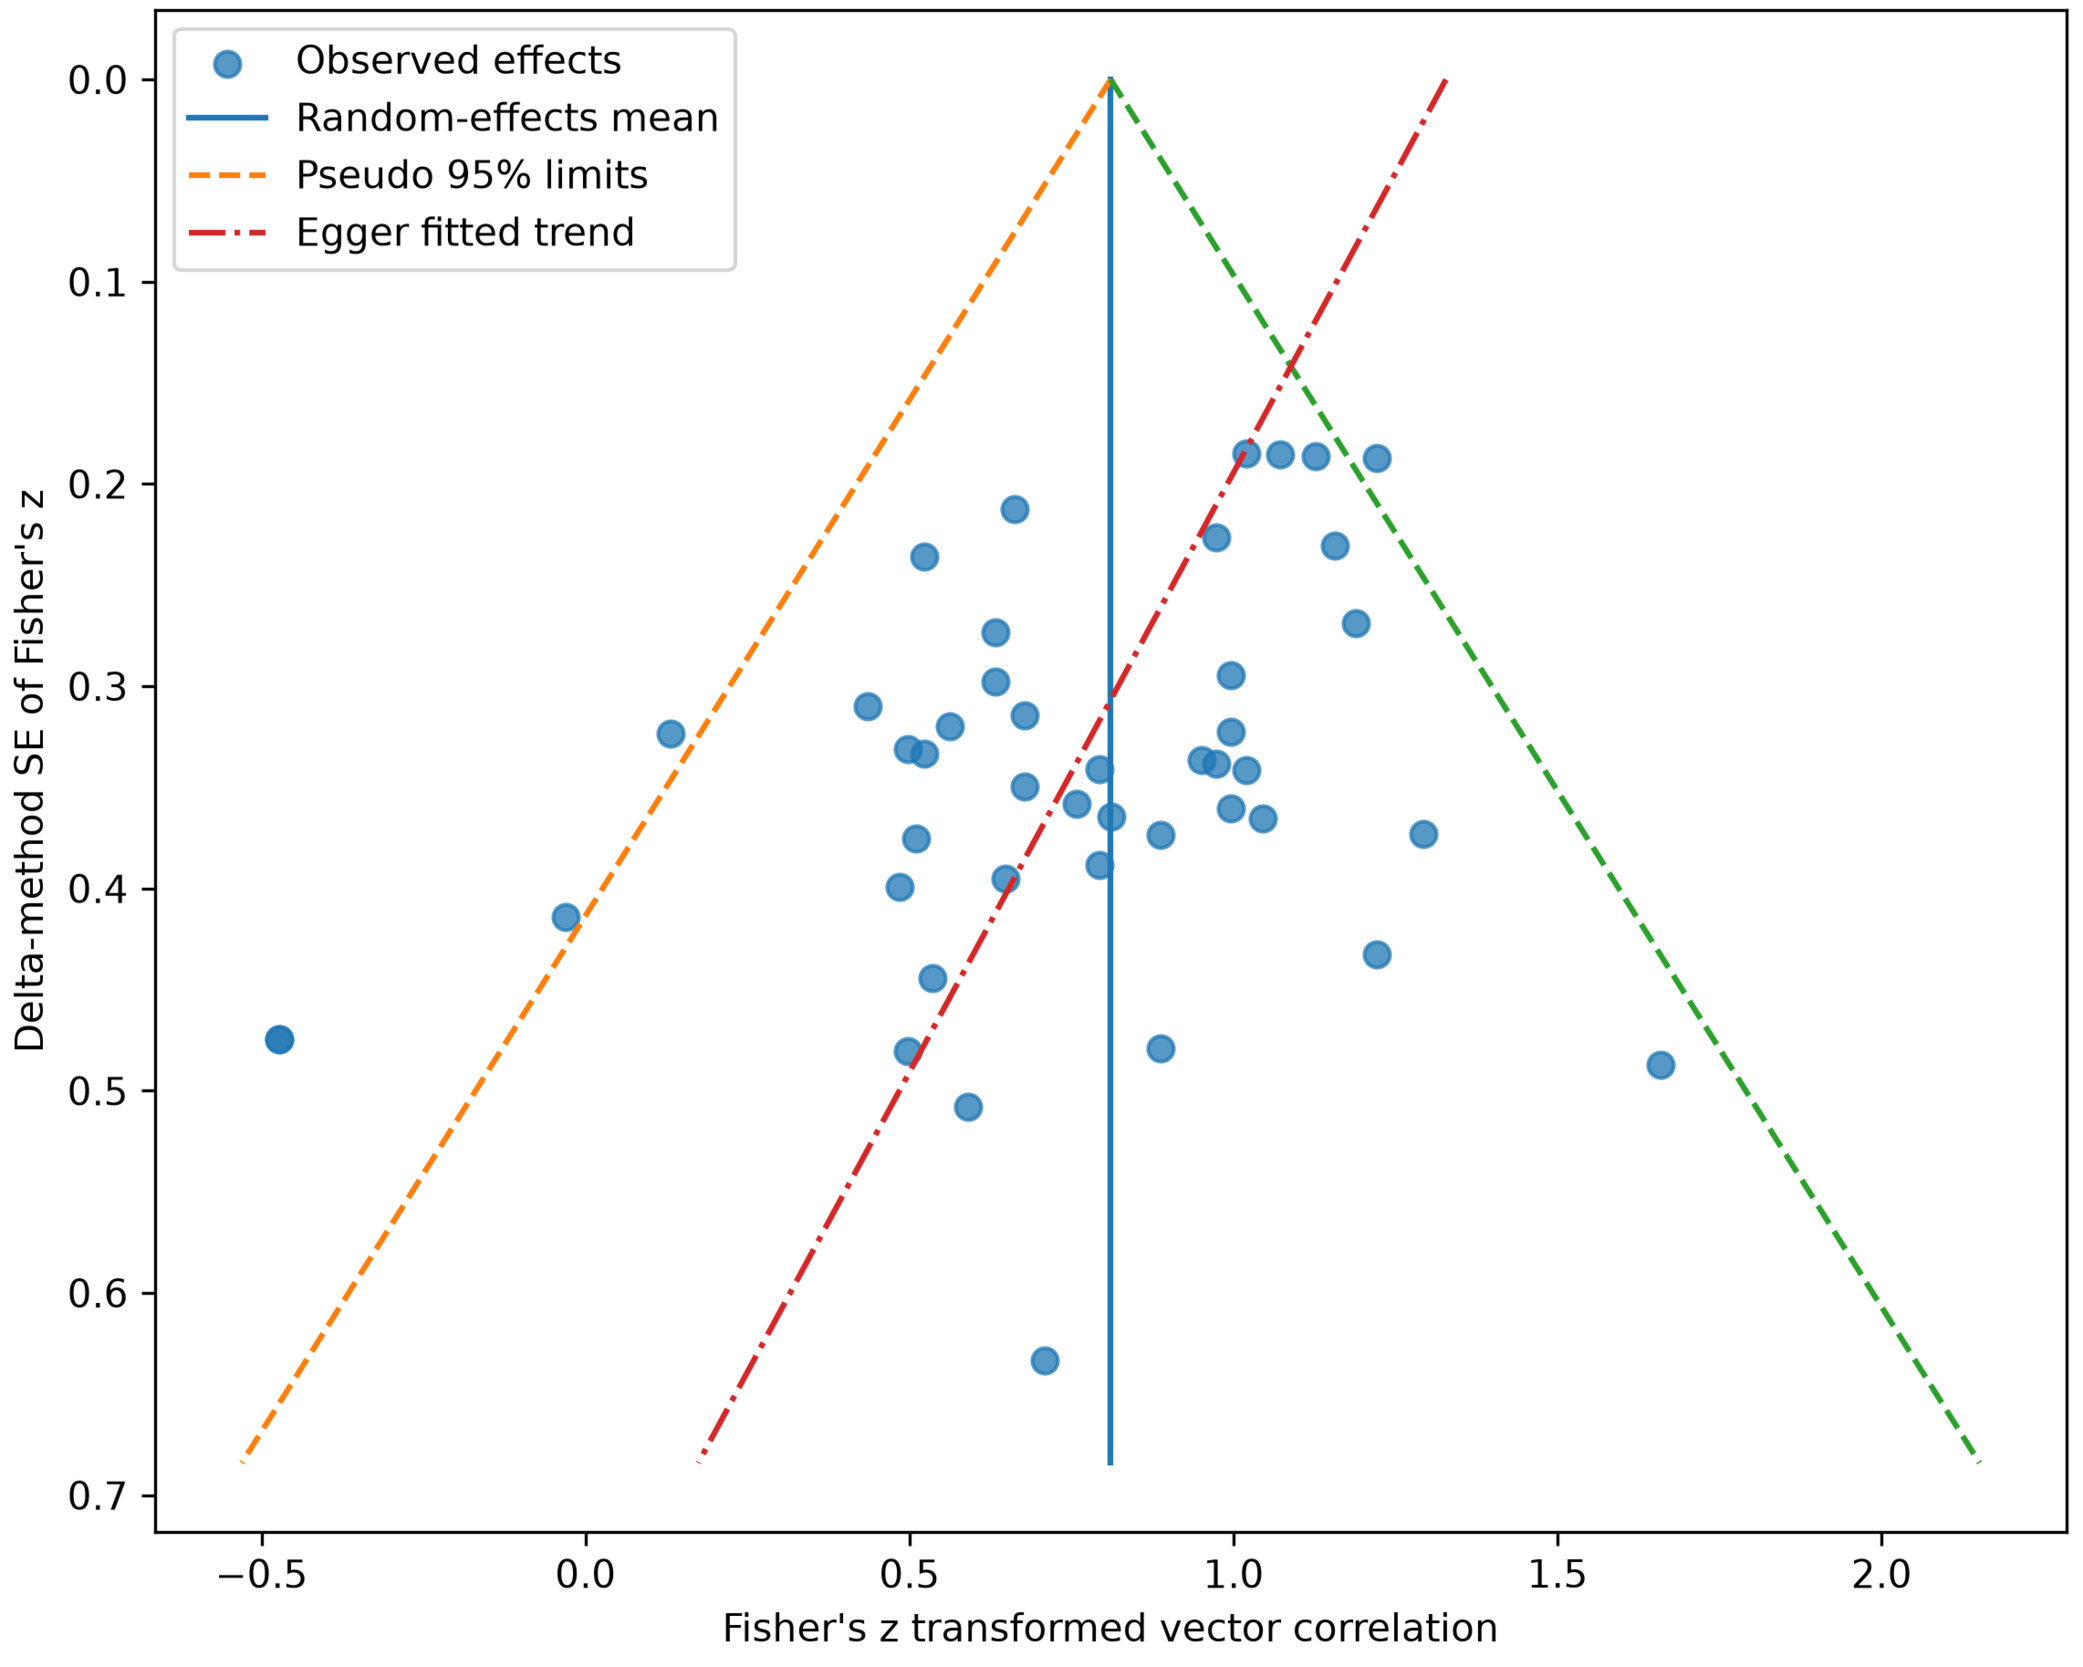
A funnel plot was generated using r-to-z transformed vector correlations to investigate whether the effect sizes were symmetrically distributed relative to the mid-line. Two sets of Egger’s regression coefficients were also estimated to determine the effects of moderators on any asymmetry in the distribution amongst effect sizes. The plot is presented in Figure 4.
The results of the Egger’s regressions (using delta-method Fisher-z SEs) are presented in Table 4.
The funnel asymmetry appears to be due, in large part, to the effects of the moderators. Once these are controlled the asymmetry becomes statistically non-significant. Trim-and-fill revealed no potentially missing effect sizes.
As the primary model is presented using a raw-r scale, a sensitivity analysis was conducted in which models that were also estimated on the Fisher-z scale were back-transformed; these yielded substantively similar results.
Discussion
The meta-analysis of SH in US W-B comparisons yields evidence of a large-magnitude effect size (r=.745, 95% CI [.699, .792]), exhibiting modest between-effect size heterogeneity. Sampling error accounts for between 46.3% and 82.7% of the variance amongst effect sizes (depending on the estimation protocol), leaving some room for moderator-related heterogeneity. The age moderator was found to exhibit a statistically significant effect. Amongst the unadjusted (z-transformed) effect sizes, funnel asymmetry plots yielded indications of significant asymmetry, however when moderator-controlled values were used, the asymmetry became non-significant. Trim-and-fill yielded no indications of missing effect sizes.
These findings greatly generalise those of more restricted meta-analyses of SH in adult US W-B data (te Nijenhuis & van den Hoek, 2016) extending their scope with respect to moderation. If increasing age is associated with a larger contribution of idiosyncratic, non-shared, health-related, and stochastic influences to cognitive-performance variance, then the alignment between g-loadings and between-group subtest differences should weaken. This is compatible with anti-Wilson-effect accounts of late-life cognition, in which the genetic structuring of g becomes increasingly disrupted by cumulative environmental insults (Sarraf et al., 2023, 2025). Age-related attenuation of SH therefore implies that such differences become less cleanly organized with respect to g, as non-g and environmentally contingent sources of variance accumulate.
Another potential mechanism is selective survival or differential morbidity in older cohorts. If selective mortality disproportionately removes lower-performing individuals from one group, the remaining sample may exhibit restricted variance on some subtests. Such a process would weaken the observed association between g-loadings and group-difference vectors, thereby attenuating SH, without necessitating a change in the latent source of the original group difference. These possibilities remain speculative, but they suggest a potentially fertile future research avenue in which cross-sectional age and mortality moderation effects on the contribution of test-specificities and error variance to the W-B difference could be examined in studies employing MGCFA. MGCFA conducted on environmentally stressed groups of Blacks and Whites (such as those from carceral or other environments exhibiting racialised i.e., racially, as opposed to socioeconomically correlated, sources of harshness, such as pollution contexts) could also decisively address the matter of the involvement (and types) of non-g variance in the generation of group differences under these conditions.
The finding that the magnitude, and even the sign of vector correlations vary across age-related contexts is inconsistent with the idea that SH is isomorphic to g (as proposed in its strongest form by Gordon, 1985).
Limitations
The primary limitation is that the effect sizes were not disattenuated for error. Factors such as range-restriction with respect to the nomological breadth of g loadings, in addition to the reliabilities of the g and W-B vectors, and even the validity of the g vector will contribute to between-study heterogeneity independently of sampling error (Jensen, 1998). When such corrections are applied, the magnitude of vector correlations will invariably increase (Jensen, 1998); however, overcorrection (where the vector correlation becomes >1.00) is a commonly encountered problem when these sorts of adjustments are applied (e.g., Woodley of Menie et al., 2018). This indicates that vector-level reliabilities have not yet been estimated with sufficient precision for full psychometric meta-analysis involving the results of studies applying MCV. Future research could attempt to meta-analyse the convergence amongst the relevant vectors to derive higher precision estimates of their associated reliabilities, making disattenuation less risky.
A secondary limitation stems from the fact that, as was noted in the Introduction, vector correlations can be distorted by subtest sampling in such a way as to yield misleading indications of g moderated differences (Ashton & Lee, 2005). It would therefore be useful to develop a heuristic scale that could approximate the degree to which a battery was potentially unbalanced with respect to sampling across domains for use as an additional moderator in future meta-analytic investigations of SH.
These are census race categories as defined in the US based on the Office of Management and Budget (1997) standards on race and ethnicity; it is in this context that the terms “Black” and “White” are used throughout this paper. This is written as White-Black (rather than the other way around) because mathematically, the difference scores are typically estimated by subtracting the latter from the former, which generally (but not always) maintains sign positivity in the resultant difference statistic.