1. Introduction
Research on sex differences in mathematics and reading remains a topic of ongoing debate, as men and women perform similarly in several domains, such as education. On the one hand, some studies showed differences in favor of boys in mathematics in certain countries, though not universally (e.g., Halpern, 2012; Maccoby & Jacklin, 1977). Conversely, girls generally outperform boys in reading across almost all countries (Stoet & Geary, 2018). Beyond reflecting curriculum mastery, it has been argued that standardized measures of academic achievement may also serve as proxies for general cognitive ability. Consistent with this view, research showed that performance across different academic domains is strongly correlated, suggesting the influence of a common underlying cognitive factor (Rindermann, 2007). Recent neurodevelopmental evidence supports this view, identifying common cognitive control networks engaged in both mathematics and reading, alongside domain-specific spatial and language contributions (Ünal et al., 2025). Adopting this perspective, analyzing these patterns provides insight into how macro-structural factors might interact with cognitive abilities.
Several factors were proposed to explain differences in cognitive abilities. Since academic competencies like reading and mathematics do not emerge without formal schooling, they inherently involve a strong environmental component. However, research suggested that biological factors may contribute to these differences. Biological aspects, such as brain structure, prenatal hormone exposure, and specific sex differences in the language system and spatial abilities (e.g., mental rotation), were highlighted as possible evolutionary or physiological precursors that might impact learning trajectories (Eals & Silverman, 1994; Finegan et al., 1992; van der Linden et al., 2017). Other theories, which argued that innate differences alone cannot fully account for sex differences, emphasized societal and cultural influences as explanations for sex differences (e.g., Halpern, 2012). For example, social and educational contexts, such as Gross Domestic Product (GDP) and economic opportunities, were proposed as contributors to the observed sex differences (Breda & Napp, 2019; Ceci et al., 2009; Eagly & Wood, 1999; Else-Quest et al., 2010). For example, higher GDP is often connected with better-resourced schools, higher-quality instruction, and increased access to educational tools and extracurricular activities (Else-Quest et al., 2010). Similarly, increased economic opportunities for women, such as increased women’s participation in research and labor markets, can help to overcome structural and societal barriers. According to Social Structural Theory, these factors affect the division of work and society expectations, impacting both parental and individual conceptions of what talents are desirable and attainable (Eagly & Wood, 1999). Also, according to Expectancy-Value Theory, when girls perceive larger returns on mathematics investment, both in education and possible jobs, they are more inclined to value and engage in mathematical study (Eccles, 1983).
Taken together, the evidence suggests that neither biological nor sociocultural explanations are sufficient on their own, and that sex differences can only be understood by considering the influence of both.
1.1. Relationship between national development and sex differences
As noted above, societal and cultural factors were proposed as explanations for sex differences. For example, some evidence suggested that the level of gender equality, defined as the parity in access to resources, opportunities, and rights across political, economic, and social domains (e.g., Global Gender Gap Index), was linked to the sex differences in mathematics, with more developed countries showing smaller differences (Guiso et al., 2008; Marks, 2008; Reilly, 2012; Román-González et al., 2017). Other studies reported no significant or mixed relationships between gender-equality indices and sex differences in mathematics and achievement in general (Else-Quest et al., 2010; Hamamura, 2012; Ireson, 2017; Munir & Winter-Ebmer, 2018; Penner, 2008). Intriguingly, Stoet and Geary (2018), using data from the Programme for International Student Assessment (PISA), found a negative relationship between sex differences in intraindividual academic strengths and the level of gender equality. This pattern, termed the “educational-gender-equality paradox”, suggested that relative to their own performance in reading, boys outperform girls in mathematics in most countries even those with high levels of gender equality. This phenomenon was recently replicated using PISA and TIMSS data, confirming the robustness of these intraindividual patterns across different assessments (Balducci et al., 2024). This seemingly paradoxical result aligns with expectancy-value theory (Eccles, 1983), which proposes that in more gender-equal countries, where economic pressures are lower and life satisfaction is higher, individuals have greater freedom to pursue educational paths that match their personal interests, rather than being constrained by economic pressures. Specifically, this framework also posits that academic choices are driven by intraindividual comparisons of strengths (e.g., relative competence in science versus reading) and domain-specific interests. Consequently, in contexts where individuals can prioritize interests over contextual pressures, sex differences in STEM engagement could become more pronounced.
In this framework, a recent study by Stoet and Geary (2022) confirmed that women are more likely to pursue people-oriented careers, while men tend to choose things-oriented occupations. Also, they found that sex differences are more pronounced in countries with higher levels of gender-equality, further supporting the gender-equality paradox previously observed in university course enrollment and professional choices (Lippa et al., 2014). Other research indicates that the magnitude of sex differences in academic performance, particularly in mathematics and reading, can vary across countries and could be influenced by living conditions (Stoet & Geary, 2013). For instance, in countries with higher living standards, the sex difference in mathematics tends to be smaller, whereas the difference in reading comprehension is larger. These findings suggest that living conditions can affect academic disparities (Herlitz et al., 2023). In addition, Balducci et al. (2024), using recent PISA and Trends in International Mathematics and Science Study (TIMSS) data, suggested that in less gender-equal countries, pressures related to life quality might promote greater engagement of women in STEM fields, thus closing the gap between men and women (Balducci, 2023).
Socioeconomic factors, such as Gross Domestic Product (GDP) and economic opportunities, were proposed as contributors to the sex differences (Breda & Napp, 2019; Ceci et al., 2009; Eagly & Wood, 1999; Else-Quest et al., 2010). Notably, sex differences in academic achievement show distinct patterns in mathematics and reading in relation to economic development. For example, in mathematics, the boys’ advantage generally decreases in countries with higher living conditions, including higher national wealth or better educational resources (Herlitz et al., 2023). However, cross-national studies, including PISA analyses, suggested that macroeconomic indicators, such as per capita GDP, are not always correlated with sex gaps in mathematics (Marks, 2008). In a recent work, Giofrè and colleagues (2020), using INVALSI data, examined the sex differences in mathematics and reading in Italy, and found a considerable association between sex differences in mathematics and the GDP, with northern regions, which are wealthier than southern regions, showing larger sex gaps.
1.2. The Italian “situation”
Italy provides a valuable opportunity to study sex differences in mathematics and reading achievement, as it is widely recognized that significant social and cultural differences exist among Italy’s territories (Felice, 2011). The difference in social opportunities between men and women is particularly pronounced in the southern part of the country (Checchi & Peragine, 2010). In fact, persistent disparities between Northern and Southern (and Isles) regions were documented across several areas, including added value (Proietti, 2005), unemployment rate (Carmeci & Mauro, 2002), industrial development (Dunford, 2008), socioeconomic resilience (Cellini & Torrisi, 2014), labor (Patacchini, 2008) and agricultural productivity (Esposti, 2011).
For these reasons, it would be misleading to treat Italy as a uniform entity (Felice, 2011). Instead, differences should be considered and examined at more detailed levels, such as regional or provincial. Regions in Italy, in fact, have separate governance and reflect distinct historical and cultural backgrounds, and currently there are variations in dialects, cuisine, artistic traditions, and other cultural dimensions.
1.3. The current study and hypotheses
For the present meta-analysis, an exceptionally large number of data points, over 23 million observations in mathematics and reading, were drawn from the INVALSI survey, while relevant social and economic moderating factors were obtained from the Italian National Institute of Statistics (ISTAT). Each year, INVALSI (Istituto Nazionale per la VALutazione del Sistema di Istruzione [National Institute for the Assessment of the Instruction System]) evaluates the entire Italian child population in the 2nd, 5th, 8th, 10th, and 13th grades. In the Italian school system, children typically attend the 2nd grade at seven years of age, the 5th grade at ten, the 8th grade at thirteen, the 10th grade at fifteen, and the 13th at eighteen. Mathematics items cover different domains, including algebra, geometry, and statistics. Reading literacy items are divided into two main areas: reading comprehension and grammar. The INVALSI data spans multiple years, geographic regions, and grades, all within the same school system that follows a nationally regulated curriculum.
Considering previous evidence on this topic, sex differences favoring boys in mathematics are expected, whereas a girls’ advantage is hypothesized for reading (Giofrè et al., 2020). It is also reasonable to expect regional differences across Italy, with northern areas showing an advantage in both mathematics and reading. Additional analyses were conducted to examine the contribution of socio-economic factors to the sex differences and their association with geographical region. In particular, we aimed to explore the so-called “gender-equality paradox”, which suggests that areas with higher levels of gender-equality may also exhibit larger sex differences (Stoet & Geary, 2018). Within this framework, a positive relationship between socio-economic development and sex differences in mathematics and reading achievement is expected. To assess whether the observed associations extend to overall academic performance, relationships between socio-economic factors and “general achievement ability” were also tested.
2. Methods
2.1. Materials
Data from the INVALSI surveys on the Italian student population (grades 2, 5, 8, 10, and 13) for mathematics and reading from 2009 to 2023 were analyzed. Tasks differ for each grade and year of survey. Each response was coded as either correct (“1”) or incorrect (“0”). For both mathematics and reading literacy, the total scores were created based on IRT (Item Response Theory) via WLE method (Weighted Likelihood Estimation). More information about the test, with examples, is available at the INVALSI website (https://invalsi-areaprove.cineca.it/). Crucially, the WLE scores provided by INVALSI are derived from a Rasch Model calibration (Item Response Theory). INVALSI procedures aim to minimize Differential Item Functioning (DIF) across subgroups through rigorous pre-testing (INVALSI, 2015, 2016, 2017). Therefore, we assume approximate measurement invariance across sex, although we acknowledge that DIF cannot be completely ruled out. The study analyzed secondary, de-identified population data provided by the INVALSI. According to national regulations for secondary data analysis, Institutional Review Board (IRB) review was not required.
A total of 26,645,542 observations for mathematics and 26,553,867 observations for reading were obtained. Data for the 2019-2020 academic year was unavailable due to the COVID-19 pandemic. In addition, in years 2009-2012 data was not available for “Bolzano”, “Monza e della Brianza”, “Fermo”, “Forlì-Cesena”, “Pesaro e Urbino”, “Barletta-Andria-Trani”, and “Sud Sardegna”; in years 2013-2014 for “Monza e della Brianza”, “Fermo”, and “Sud Sardegna”; in years 2014-2017 for “Sud Sardegna”.
For the purpose of this study, it was decided to build a “geographical gradient” variable able to synthesize the geographical coordinates of the provinces in single quantitative value. To this aim, the geographical gradient was built by labelling provinces which were ordered simultaneously by latitude (from North to South) and longitude (from West to East) with a progressive number (from 1 to 107). To do so, an angle of 40° was chosen, then longitude and latitude coordinates were rotated clockwise. Subsequently, each province was sorted by its new latitude coordinate, corresponding to its orthogonal projection on the new axis, from the northernmost to the southmost. Each province was assigned a numerical value according to this order. For example, “Venezia”, which is a northern province was assigned “40”, while “Napoli” which is a southern province was assigned “85”.
Relevant and well-known differences among northern and southern Italian regions concerning socio-economic factors were analyzed. We therefore collected data on a series of socioeconomic factors related to the geographical gradient to input as moderators in the meta-analyses. This data was retrieved and elaborated from the Italian National Institute of Statistics, (ISTAT) website (https://esploradati.istat.it/databrowser/).
The added value per inhabitant, defined as the contribution of the local production system to the national GDP (a proxy for economic productivity), was measured year-by-year from 2009 to 2022 (most recent available data) for each Italian province. High correlations were observed among the yearly measurements, with a minimum r = .87, indicating that the values did not significantly differ from year to year. To simplify the analysis and avoid redundancy without losing meaningful information, the mean value of the measurements across years was computed. The added value is expressed in tens of thousands of euros to facilitate interpretability.
The employment rate was measured year-by-year from 2009 to 2023 (most recent available data) for each Italy’s province (for 15-64 years-old people) and represents the ratio between the women’s employment rate and men’s employment rate. Again, given the high correlation among the years, minimum r = .88, the mean value of the measurements across years was computed.
The percentage of women/men in town administrations was measured year-by-year from 2009 to 2023 (most recent available data) for each Italy’s province and represents the ratio between the percentage of women and men town administrators. The moderate correlations among the years, minimum r = .43, did not suggest an overlap among the yearly measurements. To avoid distortion in the data, only the most updated info was considered, instead of computing the mean value.
University enrollment rate was measured year-by-year from 2014 to 2020 (most recent available data) for each Italy’s province and represents the ratio between the percentage of women and men who chose to enroll at university. Given the moderate-to-high correlations among the years, minimum r = .65, the mean value of the measurements across years was computed.
The hourly gross wage for employees was measured year-by-year from 2014 to 2021 (most recent available data) for each Italy’s province and represents the ratio between women’s wage and men’s wage. Again, given the high correlation between the years, minimum r = .90, the mean value of the measurements across years was computed. It is worth mentioning that for all the above-mentioned ratios, the natural logarithm was computed to enhance interpretability of the statistical analyses.
Two additional moderators were computed. First, to account for potential selection bias in upper secondary education (grades 10 and 13), we collected data on the share of students enrolled in STEM-oriented tracks (e.g., scientific high schools and technical institutes) for each province, serving as a proxy for track composition. Second, to test whether sex differences are moderated by the overall performance level, the mean provincial achievement score, averaged across boys and girls, was computed.
2.2. Data analysis
Preliminary descriptive analyses included Pearson correlations between geographical gradient and achievement gaps, and the conversion of effect sizes into standard IQ units to facilitate comparison with literature on cognitive abilities literature. A meta-analytic approach was used to estimate sex differences in mathematics and reading. Such an approach was used even though we had virtually the entire population over the mentioned time span, because data can be still considered as a sample of a much wider set of possible observations. Meta-analyses were conducted by using the “metafor” package (Viechtbauer, 2010) within the RStudio environment (R Core Team, 2023; RStudio Team, 2023).
For each year and grade level in every Italian province, the standardized difference in performance between boys and girls (Cohen’s d) and its variance were computed following Borenstein et al. (2011) formula. Boys and girls were coded as the first and second group respectively, therefore a positive Cohen’s d indicates a mean difference favoring boys, whereas a negative Cohen’s d indicates a mean difference favoring girls. In the present work, the statistical unit is represented by the effect size for a given province in a given survey year. Therefore, since multiple survey years are examined in the meta-analyses, multiple effect sizes were coded for each year, and multiple effect sizes were coded for each province.
Firstly, meta-analytic models were fitted for each grade level separately to facilitate interpretation of the sex difference in mathematics and reading. Random-effects estimation was applied to address heterogeneity across survey years (Borenstein et al., 2011). This allowed to obtain initial meta-analytic estimates of the sex difference over the grade levels considered. In a second step, a series of possible moderators was tested. At all stages, both provinces and survey years were included as crossed random effects. Throughout these steps, model evaluation and goodness of fit relied on multiple indices. As for absolute indices, “τ” (tau) and R2 were examined. The first was considered an indication of the heterogeneity; in meta-analyses with multiple levels of random effects (i.e., crossed effects), this index was computed as the sum of the single heterogeneity indices for each random level (Konstantopoulos, 2011). The second index was considered an indication of the variance explained by the model, and it was computed starting from the “τ2”, as the difference between the heterogeneity of the model with less parameters and the one with more parameters, divided by the heterogeneity of the model with less parameters, e.g., (τ12 – τ22)/ τ12) (Viechtbauer, 2010). Additionally, Intraclass Correlation Coefficients (ICCs) were computed for both province and year levels to explicitly quantify the proportion of variance attributable to geographical and temporal clustering. Variable selection followed a two-step procedure to ensure stability. First, an initial screening was performed using a stepwise selection based on the Bayesian Information Criterion (BIC) to identify a parsimonious set of predictors (Burnham & Anderson, 2007). Second, to address potential multicollinearity among the correlated socioeconomic and geographical indicators, and to validate the stepwise selection, we employed a Ridge regression. This allowed us to identify any suppressed effects (e.g., economic factors masking geographical ones) that the conservative BIC threshold might have discarded. Also, to address potential multicollinearity, we examined the moderator correlation matrix and Variance Inflation Factors (VIFs) (see Supplementary Materials).
The comparison between the best model and the null model was performed via likelihood ratio test for nested models, based on the χ² (chi-square) distribution, where statistically significant results indicate a difference between two models; this was done to ensure that the final model, taken together, significantly explains any heterogeneity. Parameters were estimated considering their weights, computed as wi = 1/(τ2+ vi), where vi is the sampling variance.
To verify the robustness of the selected models against potential spatial misspecification, we performed a sensitivity spatial analysis in which the linear geographical gradient was replaced by a two-dimensional thin-plate regression spline on longitude and latitude. The model retained the random effect for survey years to account for the repeated measures structure. Residual correlation was subsequently assessed using Moran’s I test (see Supplementary Materials). To understand the individual contribution of each moderator to the final model, a series of additional meta-analyses was conducted, in which each moderator was entered in isolation. To address the potential limitation of averaging moderators across multi-year windows, we conducted a temporal robustness check (see Supplementary Materials). We re-estimated the key meta-regression models using year-specific, lagged (t-1) values for the moderators to account for temporal precedence. For the employment rate ratio, historical data were available for the entire study period, allowing for a complete lagged analysis. However, for the university enrollment ratio, historical data availability limited the lagged analysis to specific survey waves. Therefore, the models for mathematics, examining grade 13, covered the 2018 and 2020 waves, while the analysis for reading, examining grade 10, was restricted to the 2017 and 2018 waves. Also, to rule out the possibility that the aggregate results were driven by specific influential outliers, a leave-one-out influence analysis was performed by iteratively removing one province at a time and re-estimating the models (see Supplementary Materials).
Finally, to capture the general pattern of sex differences across subjects (e.g., mathematics and reading), we performed a Principal Component Analysis (PCA) on the SMDs in mathematics and reading for each province-year combination. The composite SMD was then used in a multilevel meta-analytic model to serve as a proxy for “general scholastic sex-difference factor”, aligning the analysis with the broader literature on general cognitive differences.
3. Results
3.1. Preliminary analysis
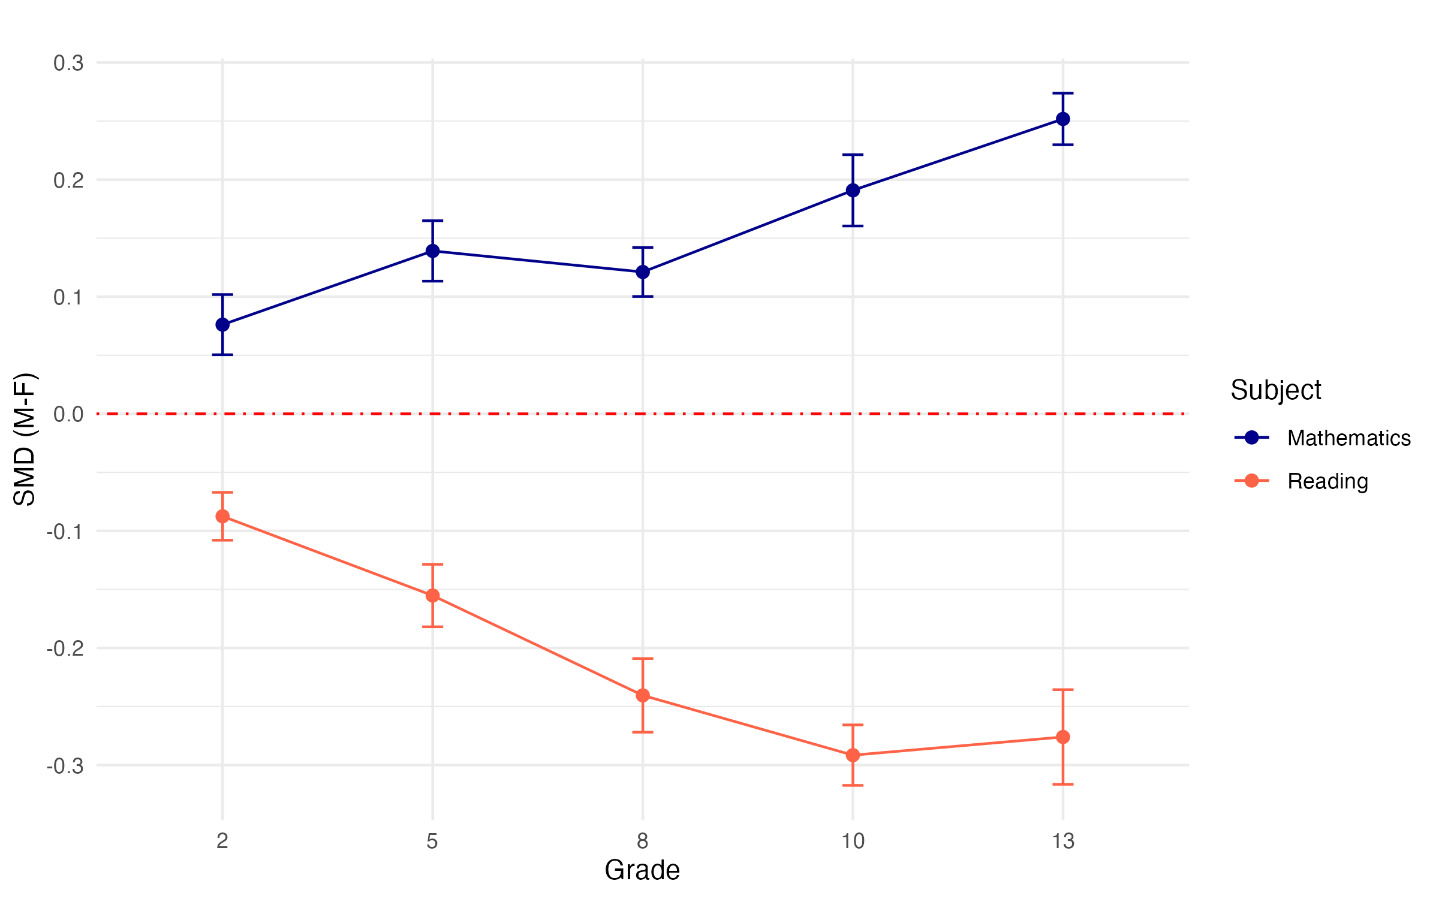
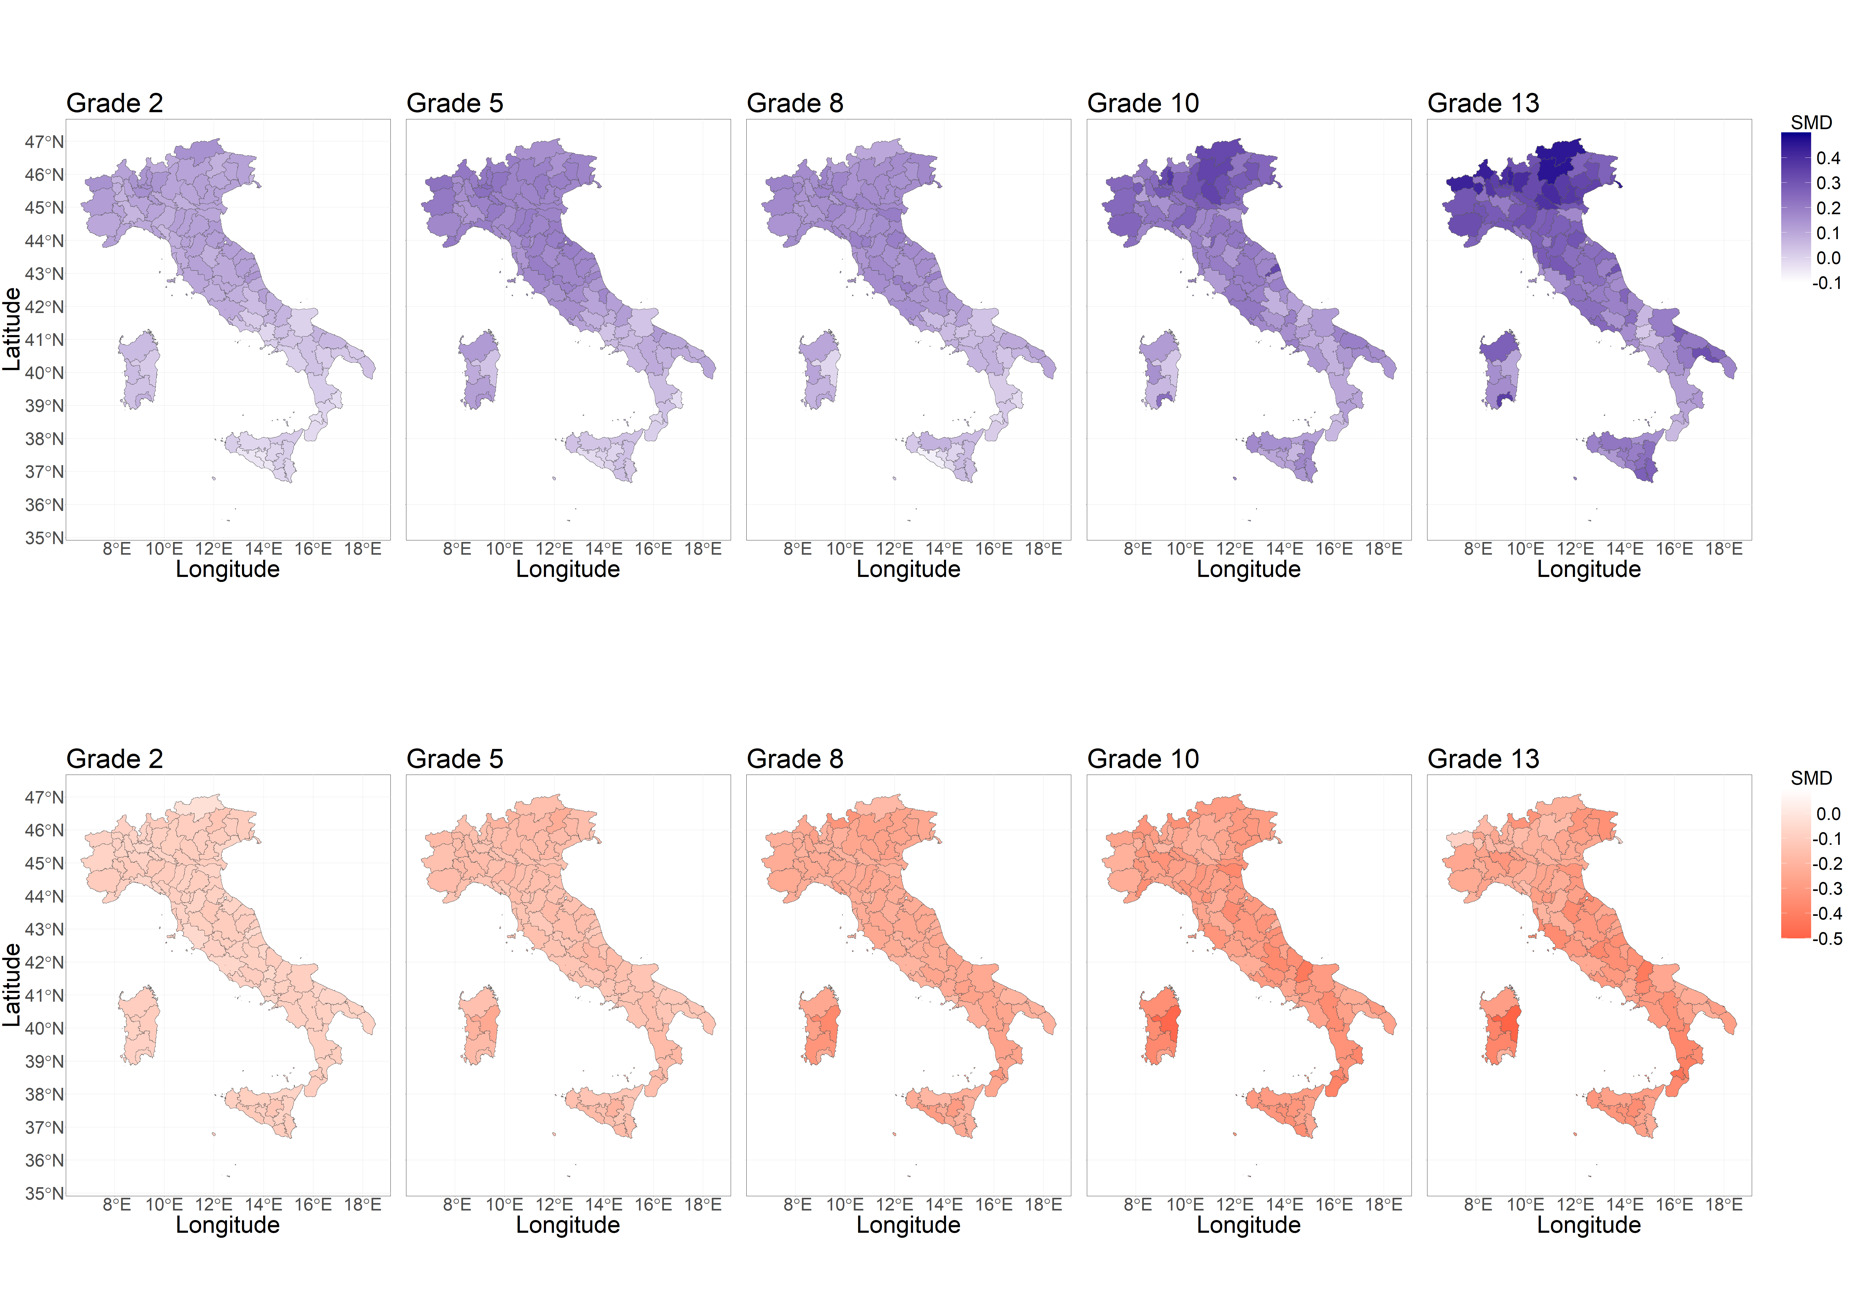
A preliminary analysis showed that mathematics and reading scores were strongly and similarly correlated across all grades (see Table 1). Results from the first series of meta-analyses on sex differences showed a boys’ advantage in mathematics increasing with grade; conversely, a similar advantage for girls was observed for reading (Figure 1). However, while the sex difference in reading performance was relatively homogeneous and increased steadily with grade across Italian provinces, the sex difference in mathematics performance followed a sharp geographical gradient, with the most northern Italian provinces presenting a larger sex difference than the most southern provinces (see Figure 2). The geographical gradient showed a strong correlation with overall mean math achievement, r = -.528. In other words, the performance gap between the northernmost and southernmost provinces corresponds to approximately 2.770 IQ units, with southernmost provinces showing lower IQ units. As for reading, again the geographical gradient showed a strong correlation with overall mean reading achievement, r = -.603. In fact, the performance gap between the northernmost and southernmost provinces corresponds to approximately 3.444 IQ units, with southernmost provinces showing lower IQ units. The geographical gradient was also significantly associated with the magnitude of the sex difference in mathematics, r = -.817, suggesting that sex differences tend to widen in northern provinces, whereas it was weakly correlated with sex difference in reading, r = -.181. Finally, consistent with the developmental trend observed (see Figure 1), grade level was positively correlated with the sex difference in mathematics, r = .386, meaning that the difference tends to widen in higher grades, with boys showing higher performance; conversely, in reading, the sex difference tends to favor girls in higher grades, r = -.668. These strong correlations across domains suggest the presence of a common underlying component, aligning with the perspective that these scores can be interpreted as indicators of general scholastic ability.
_and_readi.png)
_and_reading_(red)_across_ita.png)
3.2. Analysis of moderators
In-depth analyses were conducted on data for the mathematics performance of 13th graders, because this is the grade in which the sex differences observed are the largest, d = 0.252, indicating that the average boy scored higher than approximately 60% of girls. Focusing on the grade with the largest achievement gap allowed us to more precisely identify the factors influencing sex differences. Firstly, a null model with only random effects (i.e., provinces and survey years, was performed. Secondly, to address the high heterogeneity, several moderated meta-analyses were performed, BIC = -906.764, τ = .093, σ1 = 0.092, σ2 = 0.013, ICC1 = .980, ICC2 = .020. As for reading, further analyses were conducted on data of 10th graders, d = -0.292, indicating that the average girl scored higher than approximately 61.5% of boys. Again, due to the high level of heterogeneity, moderated meta-analyses were conducted to address this issue, BIC = -1145.219, τ = .007, σ1 = 0.048, σ2 = 0.037, ICC1 = 0.626, ICC2 = 0.373.
Preliminarily, we analyzed the correlation matrix of all potential moderators. As expected, the geographical gradient showed strong associations with key socio-economic indicators, particularly with the employment rate ratio, r = -.750, and mean added value, r = -.744. Strong correlations were also observed among economic variables; notably, the mean added value was highly correlated with the employment rate ratio, r = .800, and the university enrollment ratio, r = -.742. Furthermore, the university enrollment ratio showed a substantial negative correlation with the employment rate ratio, r = -.601, while the wages ratio correlated moderately with added value, r = -.663, and the geographical gradient, r = .565. Conversely, the ratio of women administrators showed generally weaker associations with the other predictors, ranging from r = -.360 to r = .342. Crucially, the mean achievement score showed very strong correlations with mean added value, r = .794, and the geographical gradient, r = -.753, indicating that overall performance is linked to the economic and geographical context. On the other hand, the percentage of students enrolled in STEM tracks showed negligible correlations with the main socio-economic and geographical predictors, with coefficients ranging from r = -.118 to r = .147, suggesting that track composition operates independently of the broader socio-economic framework. To address the stability of the variable selection in the presence of correlated predictors, we inspected the VIFs for the full set of candidate moderators (see Supplementary Materials).
Subsequently, we performed a series of meta-regression models to identify the best-fitting model explaining sex differences across provinces, followed by additional analyses aimed at assessing the unique contribution of each moderator (see Table 2). As for mathematics, the employment rate ratio, university enrollment ratio together with the geographical gradient and mean achievement score, resulted the best moderators of the sex difference. To address potential multicollinearity and verify the stability of the stepwise selection, we performed a penalized meta-regression using the Ridge method, including all candidate moderators (see Supplementary Materials). Our final model including the employment rate and university enrollment ratios together with the geographical gradient and averaged total score, explained about 79.815% of the variance, BIC = -1044.794, τ = 0.042, σ1 = 0.042, σ2 = 0.001, ICC1 = .999, ICC2 = .000. Specifically, the sex difference significantly decreased as the employment rate ratio, β = -0.032, SE = 0.008, 95% CI [-0.046, -0.017], and the university enrollment ratio, β = -0.052, SE = 0.006, 95% CI [-0.063, -0.041], increased. Furthermore, a significant geographical gradient was observed, β = -0.036, SE = 0.008, 95% CI [-0.051, -0.021]. Finally, the averaged total score showed a positive association with the sex difference, β = 0.033, SE = 0.004, 95% CI [0.025, 0.040], suggesting that provinces with higher mean achievement tended to exhibit larger boys’ advantages (see Supplementary Materials). Subsequently, we tested moderators again, one at a time. Regarding the geographical gradient, the sex difference significantly decreases as the gradient increases, β = -0.064, p < .001. Interestingly, these findings show that the more men and women are equally employed the more the sex difference increases, β = 0.048, p < .001. Also, the sex difference in mathematics decreases as the women-to-men university enrollment ratio increases, β = -0.073, p < .001. Although women’s enrollment is typically higher than men’s, regions where this advantage is larger tend to exhibit smaller sex gaps in math. Finally, the mean achievement score was positively associated with the gender gap, β = 0.059, p < .001, indicating that provinces with higher overall performance levels tend to show more pronounced boys’ advantages (see Supplementary Materials).
As for reading, the stepwise selection found the university enrollment ratio together with the mean score, to be the best moderators of the sex difference. Our final model including the university enrollment ratio with the mean achievement score, explained about 6.046 % of the variance, BIC = -1210.385, τ = 0.058, σ1 = 0.046, σ2 = 0.036, ICC1 = .614, ICC2 = .386. Specifically, the university enrollment ratio, β = -0.033, SE = 0.005, 95% CI [-0.042, -0.024], and the mean achievement score, β = -0.021, SE = 0.003, 95% CI [-0.027, -0.015], were negatively associated with the effect size, indicating larger girls’ advantages (i.e., the effect size becomes more negative) in contexts with higher women-to-men university enrollment ratio and mean performance. Subsequently, we tested moderators again, one at a time (Table 2). The university enrollment ratio reached the threshold for statistical significance, β = -0.025, p < .001, as well as the mean achievement showed a significant negative association, β = -0.019, p < .001, indicating that in higher-performing provinces, the girls’ advantage tends to be larger. As mentioned above, spatial sensitivity analysis and lagged temporal models were performed, highlighting robust and consistent results (see Supplementary Materials).
3.3. General scholastic sex-difference factor
A PCA was conducted across mathematics and reading by each province and assessment’s year combination. The first principal component accounted for the majority of variance, λMath = -.707, λReading = -.707, indicating that this component captures a general scholastic sex-difference factor. So, the first principal component was considered for the meta-regression, including province-level and year-level random effects. First, a null model was performed showing no statistical difference in the general scholastic sex-difference factor, d = 0.001, p = .993, BIC = 47470.225, τ = 1.109, σ1 = 1.103, σ2 = 0.114, ICC1 = .989, ICC2 = .011. Subsequently, a moderated meta-analysis was performed including all the focal moderators. Results showed that higher women-to-men employment rate ratio was associated with larger general scholastic sex difference favoring girls, β = -0.554, SE = 0.108, p < .001. Similarly, higher women-to-men university enrollment ratios predicted larger general scholastic sex difference favoring girls, β = -0.647, SE = 0.079, p < .001. The geographical gradient remained a significant predictor, β = -0.424, SE = 0.103, p < .001, indicating that northern provinces continue to show larger sex differences than southern provinces. Finally, the averaged total score showed a positive association, β = 0.401, SE = 0.017, p < .001. Residual heterogeneity was approximately τ = 0.630, σ1 = 0.622, σ2 = 0.106, ICC1 = .974, ICC2 = .026. This model explained approximately 67.720% of heterogeneity compared to the null model, BIC = 44481.1576, χ2(4) = 3015.426, p < .001.
4. Discussion
The topic of sex differences in mathematics and reading is particularly relevant today, since these skills are linked to educational achievement, professional qualifications, adult socioeconomic status, and interest in scientific disciplines (Ritchie & Bates, 2013). In this regard, the INVALSI survey, covering millions of students across all Italian provinces over multiple years, allows for a detailed and reliable examination of sex differences in mathematics and reading. At the same time, it offers new insights within a single country, in which the education system is the same in the whole country, despite territorial differences in school achievement and other societal aspects. From this perspective, the Italian context provides a unique opportunity to investigate the gender-equality paradox: despite a uniform legal and institutional framework, regional economic heterogeneity leads to situations in which apparent gender equality, such as similar wage, reflects equal disadvantage due to poverty rather than genuine equality.
Our findings showed that boys outperform girls in mathematics, and girls perform better in reading; interestingly, these sex differences tend to increase with grade level, demonstrating more considerable differences in higher grades. Notably, this study found considerable heterogeneity in sex differences across provinces, particularly in mathematics. Specifically, northern Italian provinces showed a larger sex difference favoring boys, whereas southern provinces showed smaller differences. These results are consistent with previous literature highlighting regional differences (Giofrè et al., 2020) and suggest that the socioeconomic environment could influence the size of sex differences in academic achievement. Specifically, the pattern observed along the Italian country mirrors cross-national findings, where larger sex differences in mathematics are frequently observed in more developed and gender-equal contexts (Stoet & Geary, 2013).
4.1. Current findings
As for mathematics, the employment rate and the university enrollment ratios were included alongside the geographical gradient and mean achievement score. Interestingly, our results suggest that differences among provinces could still account for a substantial portion of the heterogeneity in the mathematics sex difference, which is not explained by the socioeconomic variables.
Regions with higher women-to-men employment equality (predominantly in the North) nonetheless display larger sex differences in mathematics, while regions with a more unfavorable women’s employment ratio (predominantly in the South) show smaller gaps. This result is not entirely in line with the view that greater equality is associated with reduced sex differences in achievement (Guiso et al., 2008; Marks, 2008; Reilly, 2012; Román-González et al., 2017). Conversely, it is consistent with the gender-equality paradox, according to which gender-equality is associated with larger sex gaps in achievement. A potential caveat is that, in Italy, official employment data could underestimate women’s actual occupation, especially in southern regions where undeclared work is more common. So, the women-to-men ratio could appear lower than it really is, thereby biasing the association between gender equality and mathematics achievement. Moreover, it is critical to distinguish between the univariate and multivariate relationships observed with the employment rate ratio. While the unadjusted ecological association revealed a positive relationship with the gender gap, consistent with the gender-equality paradox, its effect shifted negative in the full multivariate model. This reversal is most likely due to a suppression or confounding effect, which is principally driven by the significant association between the geographical gradient and achievement. As a result, the partial negative estimate in the full model should be interpreted considering this interdependence.
University enrollment negatively predicted the sex difference in mathematics, specifically, the higher the women-to-men enrollment ratio, the smaller the mean difference in mathematics. Since in most cases the women-to-men university enrollment ratio is higher than one, that is, women are generally more enrolled than men, this finding indicates that the disproportion favoring females in enrollment is associated with a reduced sex gap in mathematics. In other words, this evidence suggests that when women are overrepresented in university enrollment then the sex difference in mathematics tends to close. These results could be explained by multiple factors, for example, territories with more women’s enrollment could represent cultural circumstances that favor women’s educational success. As a consequence, higher women representation in tertiary education appears to weaken the boys’ advantage in mathematics. This last finding could look partly in contrast with the “gender-equality paradox”, according to which, a higher women representation in tertiary education should be associated with larger gaps in achievement. However, in our results, we observed the opposite trend, specifically, the overrepresentation of women in university was associated with smaller sex difference in mathematics. As mentioned above, these results require careful interpretation and should be contextualized in the Italian framework. For example, internal migration from the South to the North could play a role, for instance, students who relocate for university may come from higher socioeconomic backgrounds. Such societal factors could concentrate high-performing girl students in northern regions, potentially contributing to regional variations in the women-to-men enrollment ratio and influencing the observed sex differences in mathematics. Also, while gender equality initiatives are the same throughout the country, the North is wealthier and more developed than the South, which has higher rates of poverty and unemployment. In a recent study, Giofrè et al. (2020) showed that regional GDP per capita is associated with sex differences in mathematics, in fact, the boys’ advantage was larger in the wealthier northern regions and smaller in the poorer southern regions. However, GDP explained only part of the observed heterogeneity, suggesting that socioeconomic conditions could influence the sex gap. Thus, the apparent equality in some southern locations could not be acknowledged as evidence of gender equality, but rather of equal disadvantage, highlighting how socioeconomic poverty could distort the interpretation of sex gaps. In other words, this divergence suggests a critical paradox, in fact, in Northern regions, a sex gap could reflect a more equal environment, which is favoring individual choice and interest, whereas in poorer and disadvantaged Southern regions, apparent gender equality could arise from a lack of opportunity where choices are impacted by economic pressures (Eccles, 1983).
Moreover, regarding the association between university enrollment and secondary school performance, it is crucial to clarify the direction of causality. Since tertiary education occurs after secondary school, high women’s enrollment rates cannot directly cause prior achievement. Instead, we interpret this variable as a proxy for the local opportunity structure and educational aspirations. It is worth noting that Italian universities do not require a specific number of mathematics courses for enrollment, although admission to many university programs depends on passing entrance tests that frequently include a mathematics component. However, the link between university enrollment and math performance likely reflects the tracking system. Students who intend to pursue university education predominantly enroll in academic high schools, known as Licei. These schools typically offer a curriculum designed to provide strong theoretical preparation, including mathematics, to facilitate university admission. Consequently, in provinces with high female university enrollment, a larger proportion of girls likely attended these academic tracks, receiving more extensive mathematics instruction. While internal migration from South to North is a significant factor in Italy, it typically involves students moving after graduation; therefore, it is unlikely to directly influence secondary school differences unless entire families migrate earlier. Consequently, rather than a migration artifact, higher women representation in tertiary education appears to weaken the boys’ advantage in mathematics by reflecting an environment where girls are motivated to invest in STEM-related skills earlier in their trajectory.
Finally, the mean achievement score appeared as a significant predictor, in fact, provinces with higher mean achievement levels had greater sex gaps favoring boys. This finding is consistent with the larger literature on the gender-equality paradox, which suggests that in higher-achieving environments, where educational resources are typically more available, the boys’ advantage in mathematics tends to increase. Taken together, these findings lead to an empirical puzzle: while more women’s university enrollment might be a protective factor, reducing the difference, higher overall achievement and employment parity are associated with a larger boys’ advantage.
It is worth noting that these relationships emerged regardless of the share of students enrolled in STEM-oriented tracks (e.g., scientific high schools) in each province. This suggests that the observed regional disparities are likely not just the result of selection bias into distinct curricular pathways, confirming that broader socioeconomic factors have a direct impact on the sex gap.
As for reading, university enrollment was the only socioeconomic factor that moderated the sex difference in reading, and both the geographical gradient and the employment ratio showed no significant effects on reading sex difference. In other words, higher women’s enrollment was associated with the difference in reading beyond the influence of other socioeconomic variables and the geographical gradient, with girls outperforming boys in reading as the number of women in tertiary education increases compared to number of men. One plausible explanation is that women’s engagement in tertiary education reflects broader provincial-level cultural and educational conditions that shape gendered patterns of achievement much earlier in development, rather than having a direct influence on secondary school performance. In this sense, tertiary enrollment likely functions as a contextual marker, namely, provinces with higher women’s enrollment may already provide stronger educational support for girls, higher academic expectations, and environments that reduce gendered stereotypes, which could enhance girls’ skills before the transition to university. This pattern is consistent with cross-national evidence suggesting that reading achievement is a strong predictor of university enrollment (Stoet & Geary, 2020). Consequently, the female advantage in reading likely contributes directly to the higher rates of female participation in tertiary education. It is worth noting that higher GDP and gender equality often covary across regions and countries. It might not be equality per se that drives the association, although it can loosen social and educational expectations, but rather the level of economic resources that allows individuals to pursue their strengths and interests (Stoet & Geary, 2018).
Sex differences in reading were associated with mean achievement, in fact, the higher the mean achievement, the more the girls’ advantage increased. However, the amount of variance explained by this moderator was virtually null. This partly contrasts with what we found in mathematics, where mean achievement was significantly associated with the sex difference and explained a portion of variance. Again, these relationships emerged regardless of the share of students enrolled in STEM-oriented tracks in each province. This suggests that the observed regional disparities are likely not the result of selection bias into distinct curricular pathways.
When considering both domains, a clear pattern emerges regarding how the environment shapes the gap. The mean achievement score acts as an amplifier for the stronger group. In mathematics, provinces with higher overall achievement show a larger advantage for boys. Similarly, in reading, provinces with higher achievement show a larger advantage for girls. This suggests that high-performing contexts tend to magnify the pre-existing strengths of the group that is already ahead. On the other hand, university enrollment consistently shifts the balance toward females. In mathematics, higher female enrollment is associated with a reduced male advantage, likely reflecting that in these contexts, girls intending to pursue university engage in more rigorous preparation. In reading, it corresponds to a larger female advantage, allowing girls to pull further ahead. This suggests that contexts where women invest more in tertiary education consistently characterize environments that support female academic performance across all subjects.
Finally, the results concerning the general scholastic sex-difference factor, defined as a composite factor that integrates both mathematics and reading, provide a strong validation of our theoretical framework. By examining a single underlying dimension, we found that the socioeconomic factors identified in the separate domains are not isolated patterns but could reflect a broader systemic dynamic. The fact that women-to-men employment and university enrollment ratios significantly predicted this general sex difference indicates that regional opportunity structures exert a direct influence on the overall gender gap. This supports the idea that standardized achievement measures capture a shared underlying component of academic differentiation that seems to be impacted by socioeconomic factors. In this sense, the gender equality paradox appears to extend beyond subject-specific outcomes and emerges at the level of systemic academic disparities, shaped by the broader configuration of opportunities available to women and men in each region.
4.2. Limitations
A limitation is the potential effect of item format on sex comparisons. While the INVALSI tests are designed using strong psychometric approaches, including the Rasch Model, to assure internal validity and unidimensionality (INVALSI, 2015, 2016, 2017), the technical documentation does not include specific DIF results by sex. Analytical findings (INVALSI, 2018, 2019, 2021, 2022) show that sex gaps may be altered by test structure, with multiple-choice questions favoring males and open-ended ones favoring females. Furthermore, fluctuations in performance gaps across ability levels and administration types indicate that functional non-invariance due to item format cannot be completely ruled out.
4.3. Future research
Future research should aim to further clarify the factors underlying sex differences in academic performance across Italy. In particular, it would be valuable to consider additional aspects of the Italian geography and socioeconomic context to refine or replace the current geographical gradient, including variables such as altitude, urban versus rural classification, or the prevalence of mental-health conditions. Moreover, more detailed measures of the educational environment should be considered, such as curriculum classification (STEM versus non-STEM tracks) in tertiary education and career typology (things-oriented versus people-oriented employments). By integrating these finer-grained indicators, future studies could provide a more comprehensive understanding of the mechanisms shaping sex differences in both mathematics and reading, thus providing more targeted educational policies.
4.4. Implications
These results have relevant implications for understanding educational disparities in Italy and similar contexts. The data suggest that addressing the sex difference in mathematics and reading involves more than simply ensuring equal access to education; rather, achievement gaps appear closely linked to specific regional socioeconomic conditions and the structure of educational opportunities. The finding that sex differences in mathematics are larger in northern regions implies that in developed contexts, societal norms or labor market structures may differentially influence educational choices.
Our results also indicate that university enrollment rates, which are higher for women in southern Italy, play a significant role in shaping sex differences in both mathematics and reading. This association suggests that higher levels of women’s participation in higher education act as a protective factor against sex differences. Consequently, mechanisms that foster university access for women, particularly in developed areas where it is relatively lower, could represent a key leverage point for reducing disparities in academic achievement.
It is worth noting that in our study, among the socioeconomic moderators, we considered both employment rate and university enrollment. These two indicators are typically combined when calculating the Global Gender Gap Index (World Economic Forum, 2025) for countries worldwide. However, when examining the Italian context, we observed a clear divergence: women are less employed than men, and they show higher enrollment rates in tertiary education. This divergence presents an empirical puzzle, suggesting that the relationship between education and employment is complex and varies across regions. We speculate that these two phenomena may be interrelated, reflecting structural and cultural factors that shape opportunities differently across Italy’s territories. Consequently, interpreting gender gaps using the Global Gender Gap Index alone may be misleading, as it does not capture the nuanced interplay between educational achievement and employment within specific regional contexts.
Finally, our results indicate that the boys’ advantage in mathematics is strongest in Northern, wealthier provinces characterized by higher overall achievement. Conversely, the gap is weakest in Southern areas, where economic constraints are more prevalent. For reading, the girls’ advantage is pervasive but tends to be strongest in provinces with higher overall achievement. Therefore, to transport this design to other national contexts, future research would require several key features: population-level assessments similar to INVALSI; granular, regional-level gender equality indicators rather than national averages; and distinct curricular tracking pathways, which likely interact with these socio-economic sorting mechanisms. Generalizing these results to more homogeneous or non-tracked systems should be done with caution.
5. Conclusions
This study found consistent sex differences in mathematics and reading across Italian provinces: boys outperform girls in mathematics, while girls outperform boys in reading, with differences widening at higher grade levels. A clear geographical gradient was observed, with northern provinces showing larger mathematics differences favoring boys. Socioeconomic factors, such as employment rate and university enrollment, alongside mean achievement levels, played a crucial role in shaping these gaps. Finally, these patterns were confirmed at the level of general scholastic sex-difference factor, highlighting how regional opportunity structures influence overall cognitive outcomes.
CRediT authorship contribution statement
Lorenzo Esposito: Conceptualization, Data curation, Formal analysis, Methodology, Writing – original draft, Writing – review and editing. Enrico Toffalini: Methodology, Supervision, Writing – original draft, Writing – review and editing. David Giofrè: Conceptualization, Project administration, Investigation, Validation, Supervision, Writing – review and editing.
Declaration of Interest statement
The authors declare no conflicts of interest.
Funding
This research received no specific grant from any funding agency in the public, commercial, or not-for-profit sectors.
Data availability
The data that support the findings of this study are available from the corresponding author upon reasonable request.
Ethical statement
This study is based on fully anonymized secondary data from national standardized assessments and thus did not require formal ethical approval under Italian regulations. The research adheres to international ethical standards, including the Committee on Publication Ethics (COPE), the American Psychological Association (APA), and the Declaration of Helsinki. All procedures ensured privacy, confidentiality, and responsible data use in accordance with ethical best practices.