


Introduction
In the psychometrics literature, there is (seemingly) conflicting evidence regarding which cognitive abilities[1] most strongly associate with general intelligence (g; or general cognitive ability, GCA), an issue that has substantial implications for the nature of g itself. A popular theory of the structure of intelligence originates with psychologist Raymond B. Cattell (R. Cattell, 1963), and decomposes mental abilities into two broad categories: fluid (gf or Gf) and crystallized (gc or Gc). Fluid abilities are characterized by their relative lack of dependence on an individual’s existing knowledge, and instead are thought to underlie capacities for abstract reasoning and problem-solving;[2] crystallized abilities are characterized by their relatively high dependence on an individual’s existing knowledge, acquisition of which is strongly culturally mediated, with crystallized measures thought to indicate one’s store of declarative knowledge and ability to effectively apply it to meet various challenges (see, e.g., Kan et al., 2011). Later developments in the theory of fluid and crystallized intelligence, based on foundational contributions from psychologists John L. Horn and John B. Carroll (1993), in addition to Cattell, gave rise to the Cattell–Horn–Carroll (CHC) model of intelligence (Keith & Reynolds, 2010). Higher-order CHC models generally feature three levels of psychometric aggregation: the level of the general factor of cognitive ability (g); the level of group factors denoting clusters of conceptually similar abilities that are necessarily less general than the general factor, such as Gf and Gc, but also, for example, Gs (general processing speed) and Gsm (general short-term memory);[3] and the level of subtests.[4] Hierarchical CHC models contrast with others, such as Spearman’s model of g, which features only two levels of psychometric aggregation: the g factor and the subtests onto which the former loads.[5]
It is apparent that there are two, perhaps somewhat independent, “streams” of psychometric research offering (superficially but not necessarily) contradictory perspectives on whether crystallized or fluid intelligence relates more closely to g. The apparently standard view, in light of CHC models, holds that Gf best captures g, perhaps even being isomorphic with this factor.[6] One impressively large multi-battery study specifies six group factors, including Gc and Gf, and states of the resulting model that “Gf had the strongest loading on g and a non-significant residual, supporting previous research that these two constructs are not statistically distinguishable” (Caemmerer et al., 2020, p. 9). Nevertheless, there is clear, high-quality evidence that at the subtest level, g loading, crystallization, and culture loading (see footnote 5 for a definition of this term) are positively associated (Kan et al., 2013). Although Arthur Jensen is often associated with a fluid-ability conception of g, he did not regard it as problematic that vocabulary tests are consistently among the most g-loaded subtests (Jensen, 1973, 2001).[7] This notwithstanding, Kan (2011) argues that it is “contrary” to Jensen’s (and J. Philippe Rushton’s) “biological g theory” that “cultural loading and g loading may well be intrinsically positively related”—this is “contrary” to Jensen’s theory because, according to Kan, “[i]n biological g theory . . . . [c]ulture-reduced [more fluid] tests have higher g loadings . . . than culture loaded [more crystallized] tests” (p. 54; emphasis in original). But it seems quite possible for biological g theory to accommodate this observation if it is posited that achieving mastery of and retaining (especially over the long term) knowledge received through the culture in which one is embedded are very cognitively demanding endeavors, with success in them strongly conditioned by the global biological quality of the brain.
The findings of these two “streams” of psychometric research are, prima facie, paradoxical. One would expect that if the culture loading/“crystallization” of subtests is “intrinsically positively related” to g, then if any group factor is to show virtual isomorphism with g, it ought to be Gc and certainly not Gf. Yet, as Jensen (1998) and others have noted, the opposite pattern holds at the group factor level, against the expectation that emerges from the subtest-level association between crystallization/culture loading and g loading. Kaufman et al. (2012), for example, note that “[a]lthough Gf was the strongest [Broad Ability] measure of g for both test batteries [considered in Kaufman et al.'s study], the Gc variables emerged as the best measures of g among the subtests …. Like the results for the Broad Abilities, these subtest results—namely, the highest g loadings by Gc subtests—were entirely consistent with the Wechsler literature and with empirical analyses of the KABC-II [Kaufman Assessment Battery for Children—Second Edition] and WJ III [Woodcock-Johnson III]” (pp. 133-134).
In terms of structural equation modeling, this general intelligence paradox (or g paradox) can be illustrated quite simply. One may ask: If the coefficient of the path from g (at Stratum III) → subtest (at Stratum I) tends to be larger in magnitude when estimated for subtests associated with the (Stratum-II) Gc group factor, why is it that the Gf group factor can be fixed to unity with g in many cases without losing model fit? The severity of the attenuation of the estimated g → subtest loading is negatively related to the magnitude of the Stratum-III → Stratum-II loading, as this is multiplied by the Stratum-II loading → Stratum-I (subtest-level) loading in order to recover subtest g loading. The degree of attenuation therefore should be much lower in the case of Gf -mediated paths, as this group factor is essentially isomorphic to Stratum-III g.
The g paradox arises in that, despite the foregoing, the Gc group factor loads to a greater degree onto its constituent subtests than does the Gf group factor onto its subtests (e.g., Caemmerer et al., 2020). Thus, the average g loading of Gc subtests is higher than the average g loading of Gf subtests, as the stronger Gc → subtest paths offset the almost perfect g → Gf path in cross-multiplication. Notably the finding of higher-magnitude g loadings in the case of the former persists even when subtest reliability is controlled (see Kan, 2011; Kan et al., 2013). Therefore, the paradox is not simply a function of the (often claimed) higher reliability of crystallized versus fluid subtests (e.g., Postlethwaite, 2011).
Attempted explanations of the paradox
Kan (2011) and Kan et al. (2013) employ investment theory (which holds that Gc is merely the result of Gf applied to the problem of knowledge acquisition over the life course) to account for what Jensen (2006) termed the heritability paradox, specifically “the frequent and seemingly surprising finding that h2 increases as a function of task complexity and also as function of the degree to which tasks call for prior learned knowledge and skills” (p. 133). Jensen considered this paradoxical because performance on more complex tasks and more knowledge-based tasks are dependent to a greater degree on non-genetic factors (such as learning opportunities, cultural immersion, etc.) than are more elementary forms of cognitive processing (such as measures of reaction time) that are in turn “closer” to (what Jensen believed to be) the underlying strongly heritable mechanisms that give rise to g. A slight variant of the heritability paradox, one which results from findings that more knowledge-dependent tasks are often more g loaded than relatively culture/knowledge-free but complex tests of abstract reasoning, appears in the case of polygenic scores (PGSs) for cognitive phenotypes, which tend to correlate more strongly with Gc than Gf measures (Loughnan et al., 2023). In relation to this paradox, Kan (2011) “suggest[s] that the explanation may lie in gene-environment correlation” (p. 17). He goes on to note that “crystallized ability tests happen to display the highest loadings on the general factor of intelligence” with “‘[g]eneral intelligence’ (as a statistical construct) appear[ing] to be more like ‘crystallized intelligence’ than ‘fluid intelligence’” (p. 17). Kan et al. (2011) argue that:
[I]n investment theory crystallized intelligence is not a capacity but purely a statistical entity. We contend that if CHC factor Gc represents a capacity, it cannot represent crystallized intelligence, and if Gc represents crystallized intelligence, it does not represent a capacity … from our discussion of Gc, we conclude that in investment theory the factors Gf and g represent one and the same capacity. (p. 292)
Kan et al.'s solution to the g paradox therefore is that, as Gf is g (assuming investment theory is correct), the high g loading of crystallized intelligence measures simply reflects their affinity for Gf: “Crystallized intelligence … summarizes the crystallized abilities. It is not a substantive, causal variable. Gf accounts for the correlations between the crystallized abilities” (p. 295; see also Ashton & Lee, 2005).
The principal weakness of this solution is its reliance on Cattell’s (1963) investment theory, for which direct empirical support remains limited. Perhaps the most thorough test of this theory to date did not support it: “Certain findings depart from the investment hypothesis and question the validity of Cattell’s . . . theory. Is fluid ability invested in crystallized abilities? From our analyses, the answer seems to be negative” (Ferrer & McArdle, 2004, p. 949). In attempting to rescue their model from the implications of Ferrer and McArdle’s (2004) work, Kan et al. (2011) suggest that factors other than Gf could co-contribute to the formation of crystallized ability, such as “exposure to information through education” (p. 300).
Another study that aims to make sense of the paradox is that of Pluck and Cerone (2021). These authors note that “[s]tatistically derived latent variables of fluid intelligence … (almost) perfectly predict g” (p. 3083). They further state that:
There are nevertheless some features of the positive manifold which are not so clearly explained by invoking high-level cognitive control mechanisms. In particular, the fact that crystallized intelligence, such as a person’s vocabulary or their general knowledge, typically predicts more variation in g (i.e., it has overall stronger correlations with other non-verbal cognitive tasks) than any other tests, including laboratory tests of working memory or fluid intelligence. (p. 3083)
In describing what we call the g paradox, they observe that “[t]his [the high g loading of vocabulary measures] is the ‘elephant in the room’. Why should vocabulary tests, which appear rather effortless to perform, be so highly g loaded, if the explanation for the g factor is based on effortful fluid processing?” (p. 3083). As with Kan et al. (2011), Pluck and Cerone (2021) “default” to investment theory, but they also offer novel perspective on the heritability paradox, specifically that:
[V]ocabulary ability is highly heritable, in fact the most heritable of the tests used in intelligence batteries …. It stands to reason that the actual lexical entries are learned, not inherited. Therefore, the quality or efficiency of the underlying conceptual systems appears to be the part under genetic transmission. In this sense, variation in lexical skill is somewhat heritable. (p. 3086)
These conceptual systems exhibit heritable variation and are more broadly part of the mind’s “innate structure and processes” with “lexical entries … fit[ted] into this conceptual system” (p. 3086). In other words, factors conditioning the integrity of the conceptual systems, adapted to language acquisition and other forms of learning, subserve knowledge development. The participation of these lexical “modules” in the generation of the positive manifold is hence claimed to reveal “a neglected but important role of lexical-conceptual knowledge in high-level, top-down domain-general cognitive processing” (p. 3082).
A difficulty for this hypothesis is that the modules underlying these conceptual systems should be neurologically and functionally well circumscribed, as per the most credible theories of modularity (see Fodor, 1983, for further discussion; see also Woodley of Menie & Sarraf, 2021). Functional magnetic resonance imaging (fMRI) data, however, suggest that Gc is associated with the quality of broad networks likely involving many distinct cognitive systems, which facilitate the acquisition and retention of knowledge (Genç et al., 2019). If Gc really were merely a product of quality variation with respect to a specific set of (well-circumscribed) neurological systems, this would likely have been revealed in such studies. Pluck and Cerone’s (2021) proposed solution therefore does not solve the paradox.
Formative vs. reflective models: A new level of explanation
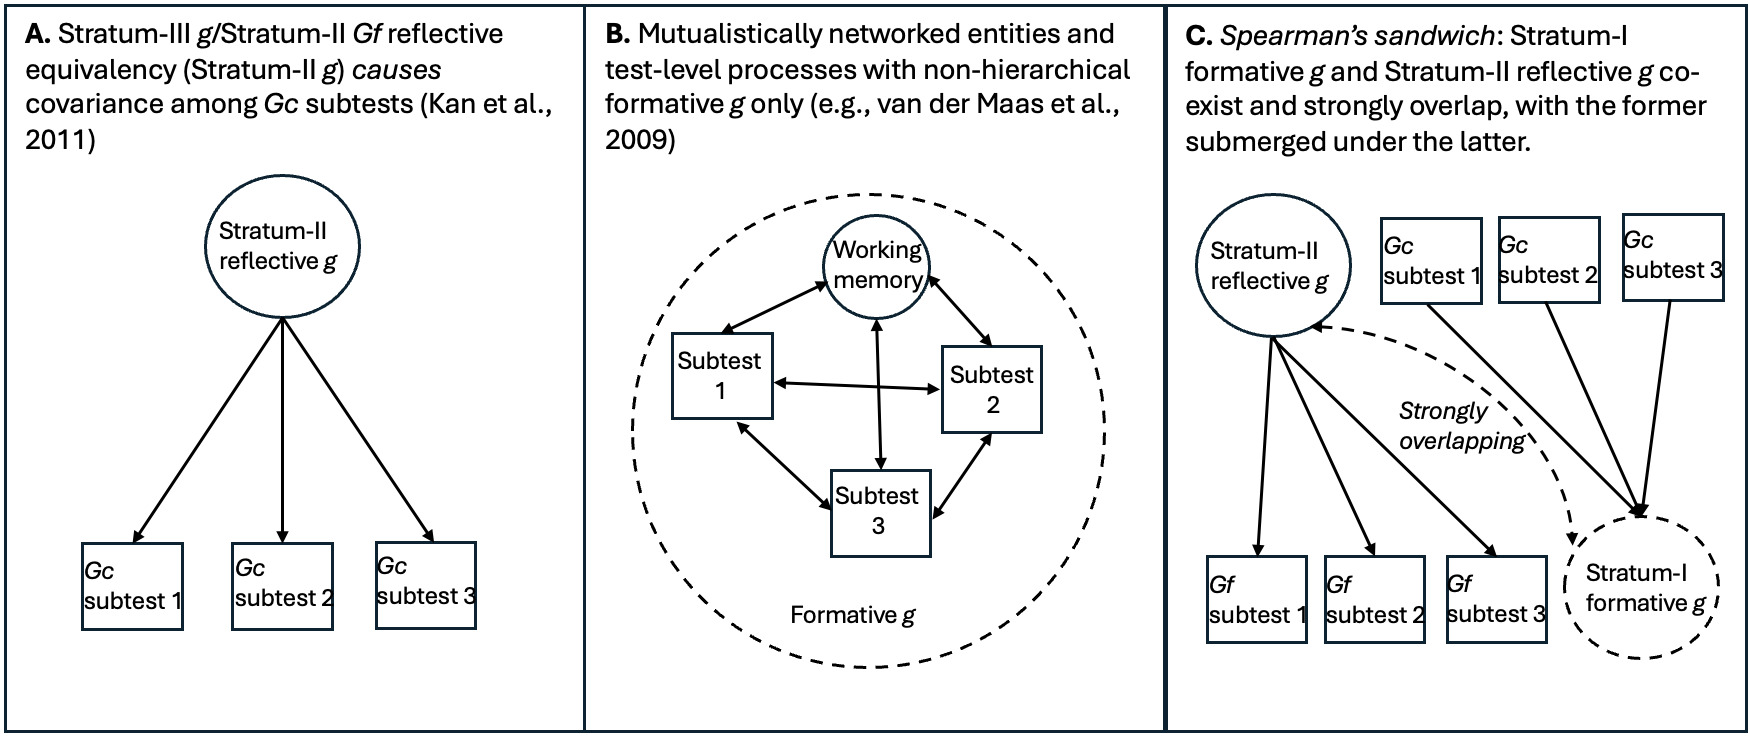
A key insight into the potential causes of the g paradox comes from research into formative versus reflective models of g. In formative models, genetic and environmental influences act on observed indicators, from which latent variables are constructed. The latent variable itself does not exert causal influence. Therefore, the latent variable is said to be formed from the action of causal factors that generate patterns of covariance among these indicators. The latent variable in this instance is not a causal entity—instead it summarizes the effects of these causal factors on its constituent components. Reflective models on the other hand reverse the pattern of mediation, such that the latent variable mediates the entirety of the effects of the causal factors on the indicators. In this instance the latent variable can be said to reflect the action of these causal factors and can therefore be described as a causal entity responsible for the covariance among its components (Bollen & Pearl, 2013; Borsboom et al., 2003; Bruins et al., 2023).
The mutualism model represents a major step toward incorporating these distinctions into descriptions of g as a phenomenon. It “implies a formative measurement model in which ‘g’ is an index variable without a causal role” (van der Maas et al., 2014, p. 12). Specifically, g indexes the action of developmental influences that selectively reinforce associations between distinct cognitive processes, giving rise to the positive manifold (Van Der Maas et al., 2006). g cannot be therefore reduced to a single reflective entity, with a distinct neurological or genetic etiology; but van der Maas et al. (2014) “[n]ote that this line of reasoning does not apply to genetic and brain research on components of intelligence (for instance working memory) as these components often do have a realistic reflective interpretation. Working memory capacity may very well be based on specific and independently identifiable brain processes, even if g is not” (p. 14). Mutualism presupposes a heterarchy among these processes. We argue that this framework does not adequately capture the hierarchical structure implied by the g paradox, particularly the psychometric stratum or level dependence of the involved effects.
We argue instead that the Gc and Gf factors arise due to the action of relatively distinct genetic, environmental, neurological, and potentially other processes, manifesting at different levels of psychometric aggregation, with formative sources of covariance operating at Stratum I (or the subtest level) and being associated with Gc,[8] and reflective/causal entities occurring at Stratum-II Gf, which are isomorphic to and completely intersubstitutable with Stratum-III g (in the CHC model) (Kan et al., 2011).
Given the aforementioned observations, the g paradox is best explained as occurring due to the following scenario: While the Gf group factor corresponds to some cluster of entities, such as working memory, (other) executive functions, and abstract reasoning ability, which collectively yield a coherent “cognitive control” architecture (e.g., Chen et al., 2019), relevant subtests are individually unable to tap all of these simultaneously with sufficient depth because of constraints on realistic item difficulty and complexity (Gf testing demands sophisticated real-time information processing and problem solving on the part of the test-taker, and such demands can only be so great before items become unsolvable for too many people to be psychometrically useful), limiting the precision of the correspondence between the subtest and the relevant entity cluster. If, structurally, Gf is relatively circumscribed/regionalized, and if adequately testing single components of it in relative isolation can be very cognitively taxing, it is unsurprising that global activation and measurement of everything that goes into Gf is challenging or impossible to achieve with any one subtest. This explains the relatively low average loading of Gf onto its constituent subtests (compared to Gc). By contrast, crystallized ability, which in its “essence” is basically the sum total of declarative knowledge and effective use of it, can be indexed well with a straightforward and one-dimensional testing modality, on the assumption that any test of a “broad” declarative knowledge domain will tend to reveal with high fidelity a person’s overall capacity to gain and retain such knowledge (e.g., vocabulary or information; see Weiss, Holdnack, & Saklofske, 2019 for similar arguments). Moreover, since solving items on a crystallized subtest typically places minor demands on attentional, working-memory, executive-function, reasoning, etc. capacities, often requiring merely the mental accessing and “regurgitation” of previously learned information, the same item-level constraints on fluid-ability testing do not apply in the case of crystallized-ability testing—what is needed is simply a sufficiently broad range of items to effectively proxy a person’s overall success in obtaining, retaining, and using declarative knowledge. This would explain why on average Gc loads so strongly onto its constituent subtests.
Spearman’s sandwich and two gs
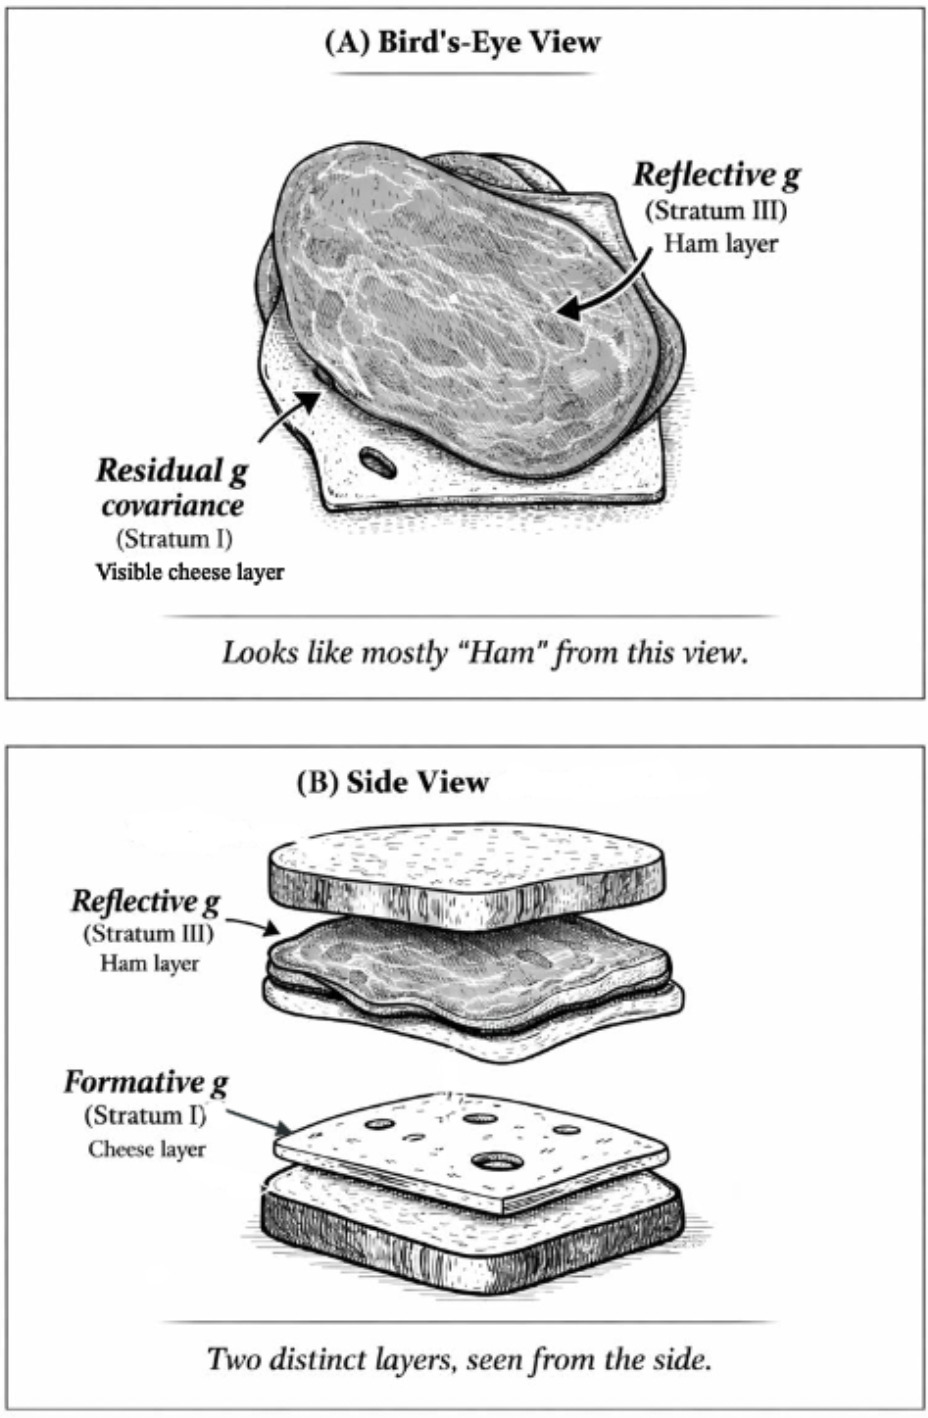
As Gf subtests measure different aspects of an entity, the high-magnitude Stratum-III g → Stratum-II Gf path involves reflective factors. Gc, on the other hand, is clearly not an entity, but a broad capacity that can be more easily measured with items tapping proxies of overall information storage and effective use thereof. The strong indifference of Gc-salient subtests with respect to the measurement of this capacity aligns with the idea that the latter is formative, not reflecting any specific neurological or genetic entity,[9] hence when g loadings are estimated at the level of Stratum I, crystallization (or culture loading) appears as a vector driving g loading across all subtests. We contend that these two distinct sources of covariance represent two effectively distinct gs, even though they overlap extensively in standard hierarchical models. To illustrate how these two gs can co-exist hierarchically we use the analogy of Spearman’s sandwich (illustrated in Figure 1).
As there is no meaningful distinction between Stratum-III g and Stratum-II Gf in CHC models (Caemmerer et al., 2020; Kan et al., 2011), this leaves an attenuated two-Stratum hierarchy of the two gs, with a formative Stratum-I g sitting immediately below a fully reflective Stratum-II g. The distinctions between the three different models discussed are illustrated in Figure 2.

Converging lines of evidence
Four major converging lines of evidence can be marshaled in support of this “two gs” model:
-
Lack of evidence for Gc as an entity: Kan et al. (2011) found, via confirmatory factor analysis, that “Gf and g were statistically indistinguishable. Gc was effectively absent, because it was statistically equivalent to verbal comprehension. Factors Gc and g could be removed from the model without any reduction in model fit” (p. 292). They go on to argue “that in the CHC taxonomy the factors Gc and g are redundant as explanatory variables” (p. 292). This indicates that Gc, unlike Gf, is not an entity and is therefore purely a formative function of the action of factors acting via certain subtests.
-
Strong associations between Gf and executive functioning: Gf is intimately linked with executive functions that generate connections between distinct mental capacities such as working memory and attention. This is evident in both the human (Chen et al., 2019; Conway et al., 2021; Salthouse & Pink, 2008) and non-human-animal literature (Burkart et al., 2017). Consistent with this, van Aken, Kessles, Wingbermühle, van der Veld, and Egger (2016) found “[a] very high correlation between Gf and EF [Executive Functioning] … (0.91), with working memory being the most profound indicator.” However, only “[a] moderate to high correlation between Gc and EF was present” (all quotes from p. 31). These findings strengthen the prediction that these cognitive systems might be the source of Gf’s entitivity.
-
Discriminability in functional magnetic resonance imaging (fMRI) studies: In terms of functional analysis of brain activity patterns, Gc and Gf are discriminable (Thiele et al., 2024). Moreover, the data are also highly suggestive of a formative basis for Gc in the relevant network architecture. Genç et al. (2019) found that a key component of Gc, general knowledge, “is heavily dependent on the quality of a widely distributed brain network that allows for an efficient integration of information” (p. 600; emphasis added). Gf, on the other hand, is associated with neurologically well-circumscribed structures. In one fMRI study of Gf, that of Ebisch et al. (2012), it is noted that “tasks [induction, visualization, and spatial relationships] activate a shared frontoparietal network. Specific activations were also observed, in particular for induction and visualization” (p. 331). This apparent distinctness at the level of generalized vs. localized activity patterns also suggests that the processes that undergird the formation of Gc are more robust to age-related degeneration (being highly redundant) than are relatively neurologically delimited processes, such as those associated with Gf, potentially accounting for the different observed trajectories assumed by these two group factors with advancing age (McDonough et al., 2016; Yuan et al., 2018).
-
Genetic discriminability: Christoforou et al. (2014) used GWAS-based path analysis to differentiate between measures of fluid and crystallized intelligence. It has also been found that neuropsychiatric disorders exhibit different genetic associations with fluid and crystallized intelligence (Londono-Correa et al., 2025). This strengthens the inference of separate sources of covariance with different organic bases, which could correspond to distinct gs.
Predictions to be tested
First, an attempt will be made to establish whether, using one especially high-quality dataset (Caemmerer et al., 2020), the g paradox can be recovered via re-analysis of path models. Specifically, the aim is to determine if Gc subtests exhibit higher average g loadings than Gf subtests, despite Gf and g being “not statistically distinguishable” (p. 9) at Stratum II.
The work of Caemmerer et al. (2020) is noted for its exceptionally broad and deep coverage of mental abilities—66 subtests total from which six group factors were extractable: Gf, fluid intelligence; Gc, crystallized intelligence; Gs, processing speed; Gwm, working memory; Gv, visuospatial processing; Gl, learning efficiency. These subtests were sourced from six gold-standard intelligence test batteries: The Kaufman Assessment Battery for Children, Second Edition (KABC-II); the Wechsler Intelligence Scale for Children, Third, Fourth, and Fifth Editions (WISC-III, WISC-IV, and WISC-V); the Differential Abilities Scale, Second Edition (DAS-II); and the Woodcock-Johnson Tests of Cognitive Abilities, Third Edition (WJ III). Moreover, data for these subtests were gathered in a body of samples comprising 3,927 youths (aged 6 to 18 years; these batteries have been found to exhibit strong measurement invariance with age). These were “standardization and linking samples collected by Pearson Assessments during norming and validity studies of their intelligence measures” (Caemmerer et al., 2020, p. 3; emphasis added), and therefore the quality of sampling is very high.
If the g paradox is present in Caemmerer et al.'s data, we would expect the following hypotheses to obtain:
H1: The correlation between Stratum-I or subtest g loading and degree of subtest affinity for the Gc group factor should be positive, and of larger magnitude, when compared to the affinity patterns involving the other five group factors. (“Affinity” is here a shorthand term for the degree of association between a subtest and a given group factor.)
H2: The rated “culture loadings” of the group factors should moderate the strength of these affinity patterns. This is a test of Kan’s (2011) thesis that so-called “culture loading” is a major source of variation in Stratum-I or subtest g loadings, with more culture-loaded subtests being more crystallized (see also Kan et al., 2013).
The rationale for H1 and H2, in light of the theory here advanced about the nature of the g paradox, is that the more crystallized a subtest is, the more closely it should tap an individual’s ability to master information acquired through culture, and such mastery should depend on the quality of the brain’s global information-storage network (the formative Stratum-I g). This should yield a vector across subtests driving higher g loading as a function of higher crystallization and culture loading. The “fluidity”/“culture-freedom” vector, by contrast, should be weaker, given that single subtest measures of fluid ability will never be particularly strong measures of the germane construct, for reasons specified earlier in this Introduction, and that, given the assumption that fluid and crystallized intelligence are the primary sources of g, factors less related to both constructs should have weak or even negative associations with g.
These findings should be robust to controlling for subtest-level reliability, as per Kan et al. (2013).
The following additional hypothesis was tested via re-analysis of the covariance matrices provided to us by Jacqueline Caemmerer (note that only these matrices and no standardization data were shared):
H3: A key prediction of our model is that the “widely distributed brain network” that forms Gc (and thus formative Stratum-I g) is easier to activate on a single-measure basis than are the entities composing Gf (reflective Stratum-II g). To test this, we determine whether network analysis of the portions of Caemmerer et al.'s (2020) covariance matrices corresponding to the 12 “pure” (non-cross-loading) Gc subtests and the 12 “pure” Gf subtests allows distinct Gc and Gf networks to be estimated and compared on density, weighted-strength, edge-weight, and node-centrality statistics. As the network model necessarily constrains the analysis to interrelations among subtests at Stratum-I, Gc (proxying a distinct g “factor” whose interrelations are driven by formative processes) is predicted to perform better than the corresponding Gf network on all of these network quality measures.
Research employing a number of large genotyped cohorts has found evidence that, in the case of g, both formative and reflective processes are at work, with phenotypic g mediating between 31% and 81% of the effects of genetic g factors (confirmatory factor-analytic latent variables comprising associated intelligence PGSs; de la Fuente et al., 2021) on the relevant subtests in the different studies (see Woodley of Menie et al., 2025; for a similar study using a broader set of traits, see de la Fuente et al., 2025). Generally weaker residual direct positive effects of genetic g were also found on many subtests, suggesting the presence of discrete formative influences. In light of these observations another hypothesis will be tested:
H4: In the four SEM analyses conducted by Woodley of Menie et al. (2025), the direct paths from genetic g to the subtests should significantly contrast with respect to a variable capturing whether the subtest is classed broadly as Gc or Gf. Meta-analysis of the outputs of these four SEMs should yield indications of a significant contrast parameter across the set of studies, with genetic g loading onto Gc-designated subtests to a significantly greater degree than in the case of the Gf-designated ones.
This is another very direct test of the model, specifically that Gc emerges from the action of genetic factors acting directly on relevant subtests, which are also independent of the indirect influence of reflective phenotypic latent variables on said subtests. It should also be possible to examine the extent of the residual covariance (allowing for an estimation of the span of the formative g) with respect to those studies that exhibit the broadest nomological breadth.
Methods
Analysis 1 (Tests of H1 and H2)
Two separate analyses are performed to test H1 and H2. For the first, Stratum-I g loadings are estimated using Caemmerer et al.'s (2020) confirmatory factor-analytic model (p. 8). This is done via path cross-multiplication, with the resultant coefficients then corrected for unreliability using reliability coefficients obtained from the sources of Caemmerer et al. (p. 4). To test for the paradox a simple vector correlation model is used in which a subtest is assigned a value of 1 if it is uniquely associated with the Gc group factor and 0 if it is associated with non-Gc group factors. In three cases, subtests exhibited two separate paths, one of which indicated an association with Gc. In these instances, the subtests were coded 0.5. A positive correlation would indicate that Stratum-II Gc affinity moderates Stratum-I (subtest) g loading. Similar analyses are performed using the other five group factors as contrast conditions (Gf, Gwm, Gv, Gs, and Gl; one subtest, onto which Gc did not load, is associated with three different group factors, so in its case, group-factor affinities are coded as 0.333). Finally, the six group factors are independently ranked in terms of their “culture loading” (based on separate ratings provided by two of the authors, informed by descriptions of the constituent subtests; this method is similar to the binary “subjective cultural loading” assignation approach of Gonthier et al., 2021) and the average of these ratings is correlated with the vector of the correlations between subtest Stratum-I g loadings and their “affinity” for each of the six group factors. This tests the degree to which the rated “culture loadings” of the group factors moderate the pattern of affinity—g loading correlations.
Analysis 2 (Test of H3)
In testing H3 the covariance matrices from Caemmerer et al. (2020) corresponding to the 12 non-cross-loading Gc and 12 non-cross-loading Gf subtests are transformed into adjacency matrices using an absolute value threshold approach. In turn, retained correlations are treated as weighted, undirected edges. The corresponding networks are generated with the igraph package (Csardi & Nepusz, 2006). Edge weight is estimated for each network and operationalized as the proportion of all possible edges that are present. Kolmogorov-Smirnov (KS) tests are computed on the nonzero edge weights and distributions of strength centrality across networks. Significance tests are used to determine whether there are differences between each of the two networks in relation to these four parameters.
To control for possible Type-I errors the Gc and Gf networks are allowed to be iteratively mixed with 50% random items across 1000 iterations, to determine whether their presence leads to the same observed network differences as those noted in the initial step. In each iteration, the edge weights are pooled, randomly permuted, divided into two groups of equal size, and used to create a null distribution of differences in densities. Additionally, weighted node strength is estimated for each network, and a significance test is performed across the mean strengths.
A major advantage in employing Caemmerer et al.'s (2020) data for these analyses is that each network has the same number of nodes (12), and in each case these are subtests with unique affinities for their respective group factors, making this a very fair comparison. Unless they are properly constrained, network models have a tendency towards overfitting (Costantini & Perugini, 2017). The use of network analysis here is theoretically appropriate also given the predicted properties of the germane constructs, specifically that when constrained to Stratum I, the covariance associated with formative influences should exhibit the stronger networking properties—a network being an almost pure representation of formative effects on covariance.
Analysis 3 (Test of H4)
For the test of H4, the SEM analyses involving four studies (English Longitudinal Study of Aging [ELSA], Midlife in the US Genetic [MIDUS G], Health and Retirement Study [HRS], and Harmonized Cognitive Assessment Protocol [HCAP]) from Woodley of Menie et al. (2025) are re-run using broad Gc or Gf categorical variables to detect differences in path means (via the generation of a contrast parameter). These analyses are conducted using lavaan 0.6-18 (Rosseel, 2012). (Two of the current authors [MAW and JGRF] coordinated in assigning each subtest in each study to one or the other category [coded 1 and 0].) Random effects meta-analysis of the contrast parameters is conducted using the metafor package (Viechtbauer, 2015). Supplementary Table S1 contains the “Gc” vs. “Gf” coding for each of the 46 subtests from the four studies sourced from Woodley of Menie et al. (2025), along with the rationale for assigning each subtest to one or the other category.
Results
Analysis 1 (Test of H1 and H2)
Consistent with the reality of the g paradox, (1) the average g loadings (derived via path cross-multiplication) of the 12 “pure” (non-cross-loading with any other group factor) Gc subtests is 0.71, versus 0.66 for the 12 corresponding Gf subtests (each subtest was corrected for its reliability coefficient); and (2) the loading of g onto the Gc group factor is 0.81, while the loading of g onto the Gf group factor is 0.99. The correlation between subtest (Stratum-I) g loadings and the affinities of each subtest with the (Stratum-II) group factors indicates, consistent with H1, that the Gc affinity pattern is the most positively associated with the (reliability-corrected) g loadings (rx=0.449, 95% CI: 0.233 to 0.623). The broad factor that is clearly the most culture free, Gs, exhibits the exact opposite pattern consistent with the prediction that a dimension of crystallization is driving g loading at Stratum-I (rx=-0.532, 95% CI: -0.685 to -0.333).
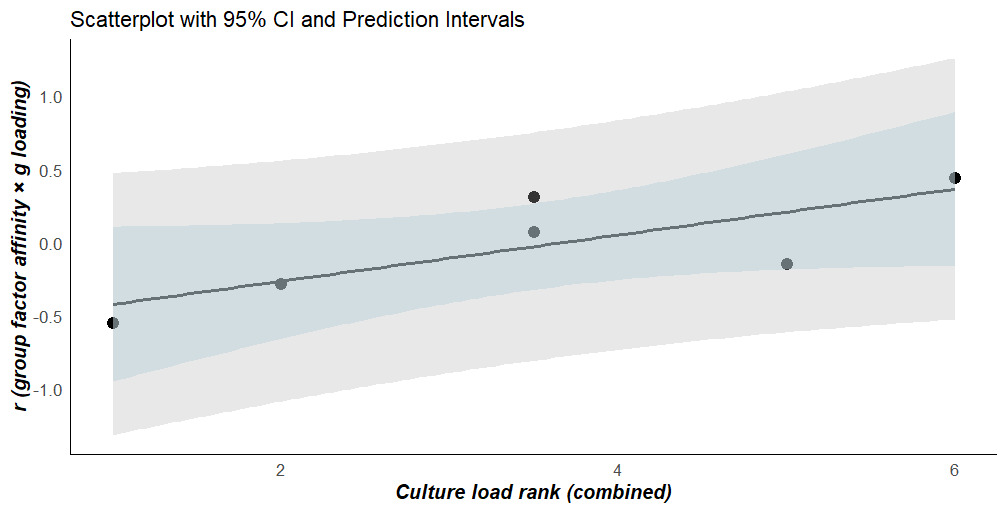
The “culture-loading” rankings of the group factors exhibit high inter-rater reliability (r=0.943, n=6, 95% CI: 0.561 to 0.993, p<.05, K=2 raters). The average of these “culture-loading” rankings has a directionally[10] significant and positive correlation with the values estimated in the previous step (r=.780, n=6, p(one-tailed)=.034), consistent with H2. Table 1 presents the two sets of “culture-loading” ranks, along with the average, and the g-loading-affinity correlations for each of the group factors. Figure 3 plots the results of testing H2.
Analysis 2 (Test of H3)
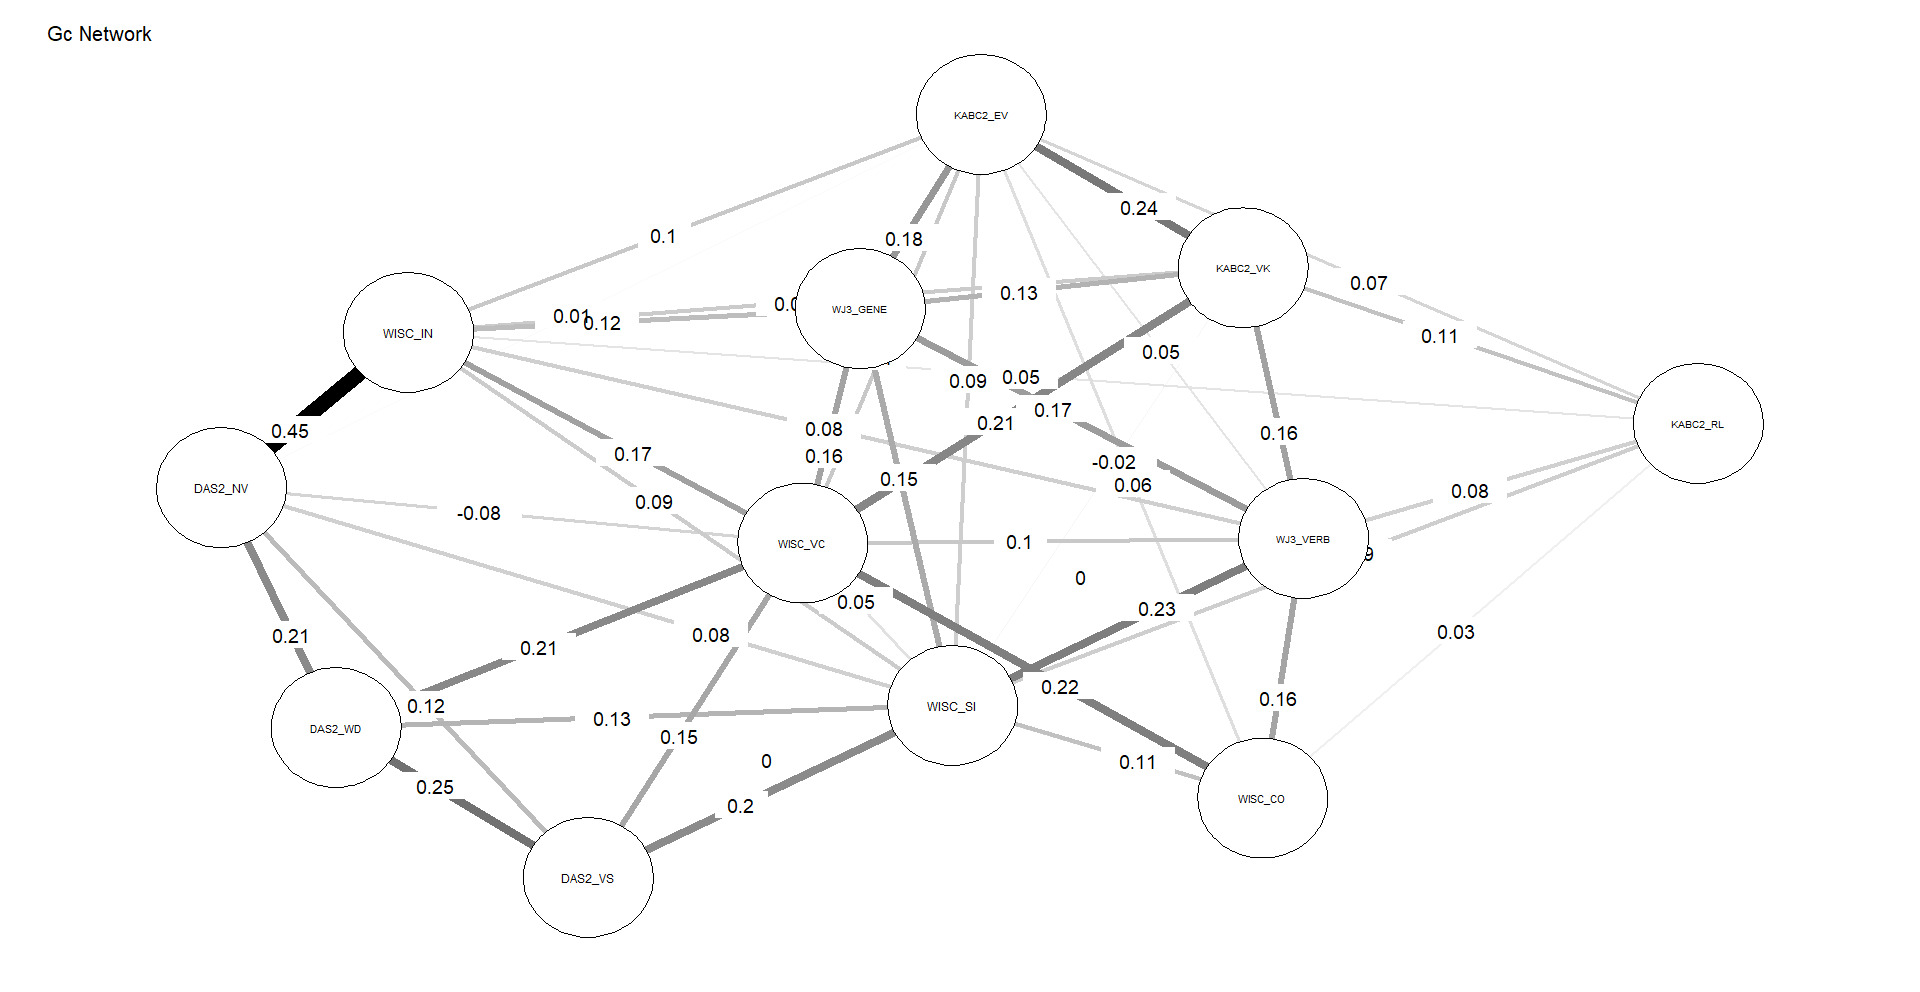
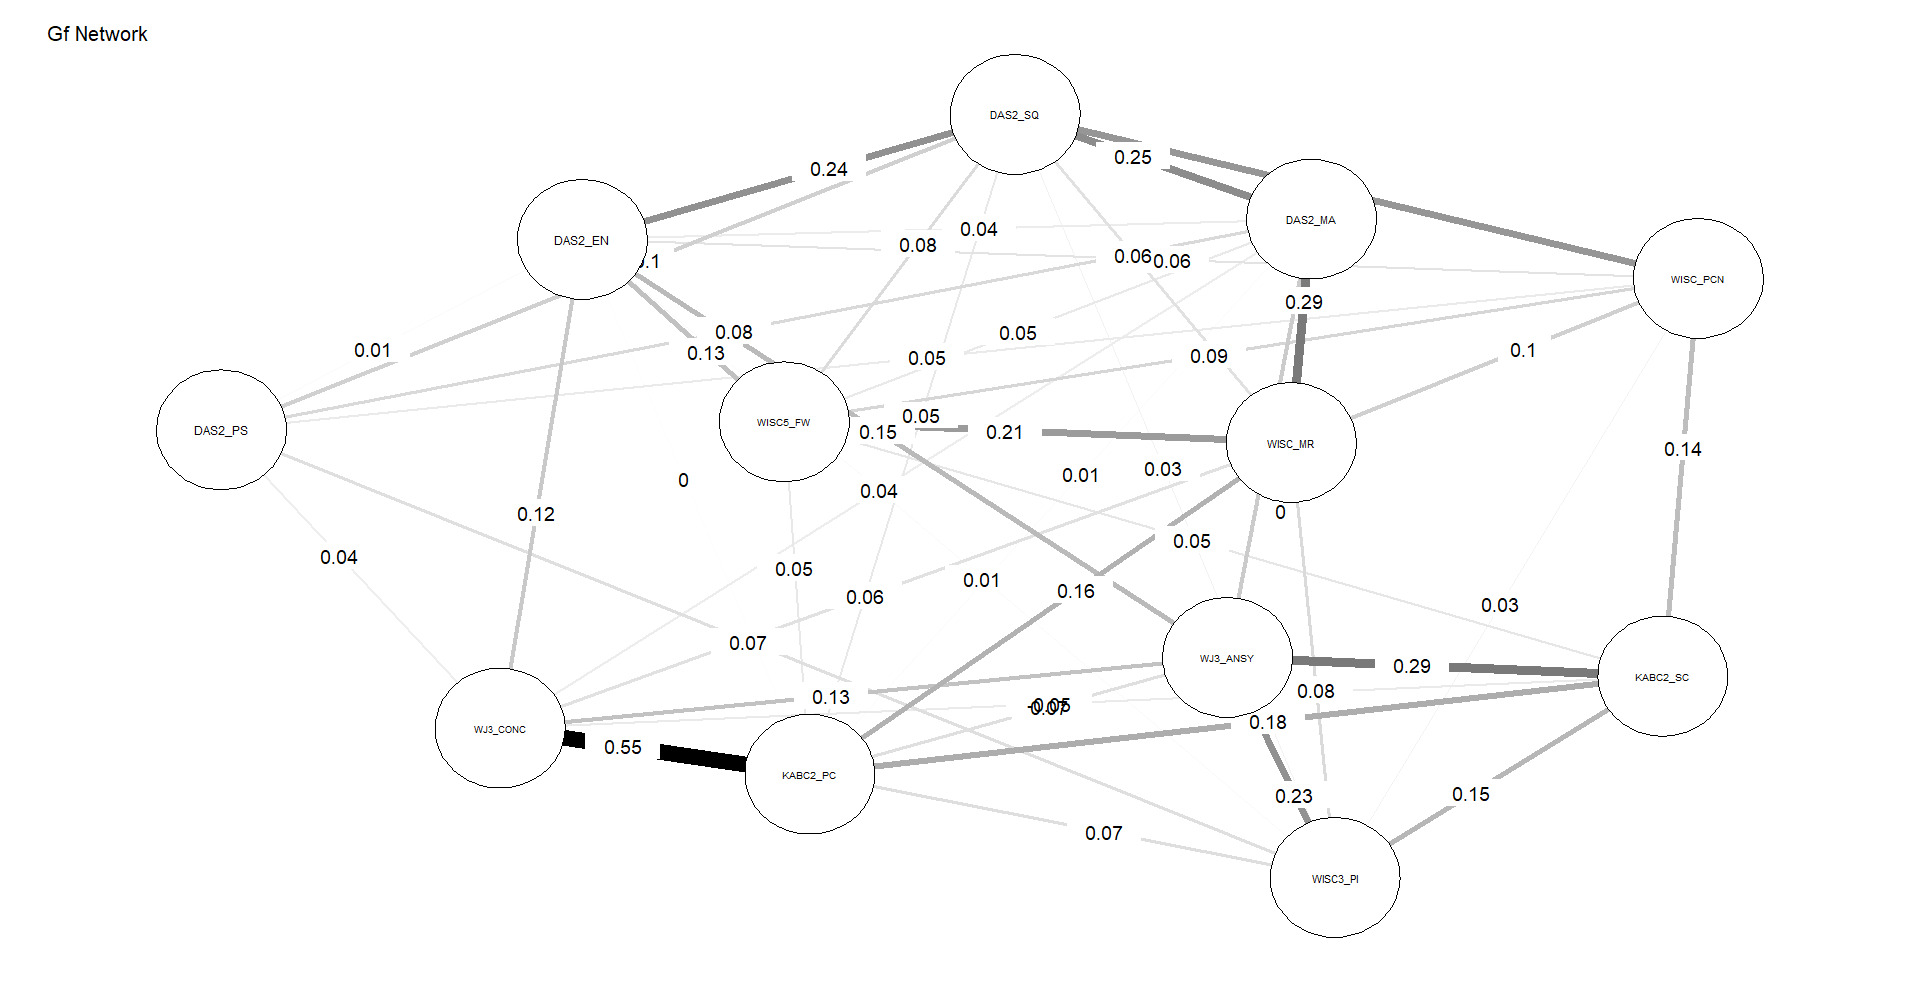
Figures 4 and 5 depict the network structures of Gc and Gf respectively. The full names of all subtests are included in the Appendix (Table A1).


As shown in Table 2, the Gc network exhibits substantially higher density and weighted strength than the Gf network, indicating that a larger proportion of possible connections are present and that these connections are, on average, stronger. In addition, the distributions of edge weights and node centrality differ significantly between the two networks, as indicated by KS tests. Taken together, these results demonstrate that, under identical modeling constraints, Gc forms a more strongly connected and internally cohesive network than Gf, without implying functional specialization or causal organization among individual nodes, consistent with H3.
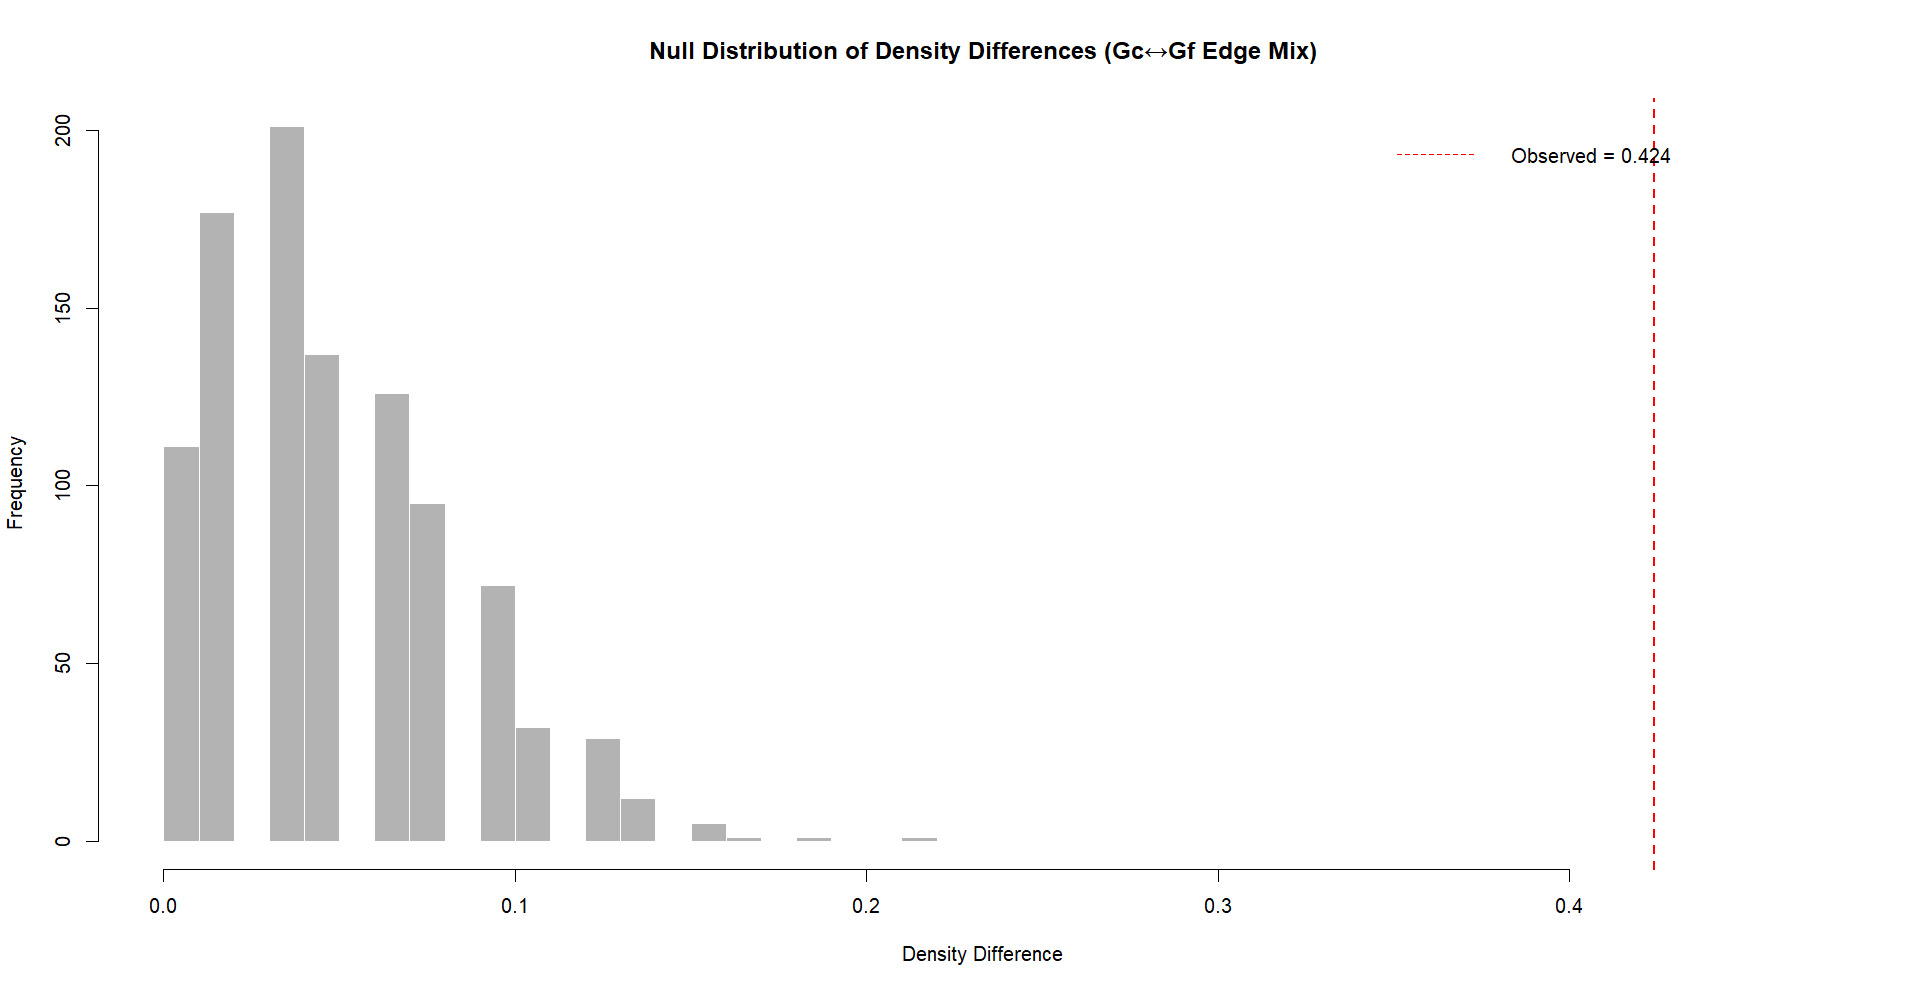
The robustness analysis indicates that the null distribution of density differences following 1000 mixed iterations was considerably smaller than the observed differences between Gc and Gf networks. As displayed in Figure 6, the observed density difference is located on the far-right tail of the null distribution, with the proportion of permuted differences that were equal to or exceeding the observed value remaining low in frequency. Consequently, these results strongly suggest that the observed density difference between Gc and Gf networks is not an artifact of random mixing or edge distribution, instead reflecting a robust structural difference between the networks.
Analysis 3 (Test of H4)
Table 3 presents the results of estimating the contrast parameters (difference in the means of the paths estimated among the Gc- and Gf-designated subtests) for each of the four datasets analyzed in Woodley of Menie et al. (2025), along with the random effects meta-analytic contrast parameter.
Various heterogeneity statistics were also estimated for the meta-analysis. The tau2 value (estimated amount of total heterogeneity) was 0.0012 (SE = 0.0013). The I2 value (total heterogeneity / total variability) was 91.69%, and the H2 value (total variability / sampling variability) was 12.04. The Q statistic (for df = 3) was 36.1168, p< .0001. These values indicate the presence of significant between-study heterogeneity.
Consistent with H4 the overall meta-analytic contrast parameter score is positively signed (meaning that the direct paths to Gc-assigned subtests are larger than those to Gf-assigned subtests) and is statistically significant. Moreover, the effect is significantly present in three of the four datasets.
Finally, we explore the nomological breadth of the positive manifold of the formative g factor with respect to a separate analysis of the HCAP dataset using unconstrained path estimation (this was not possible for the other datasets, as constraints were necessary for the other path models to achieve stability). Figure 7 illustrates the direct paths from the genetic g factor to the phenotypic manifest variables (estimated net of the phenotypic g factor; indirect paths through phenotypic g not shown). We argue that these genetic effects on the subtests are indexing the formative Stratum-I g, hence we depict this as a latent variable emerging from the subtests.
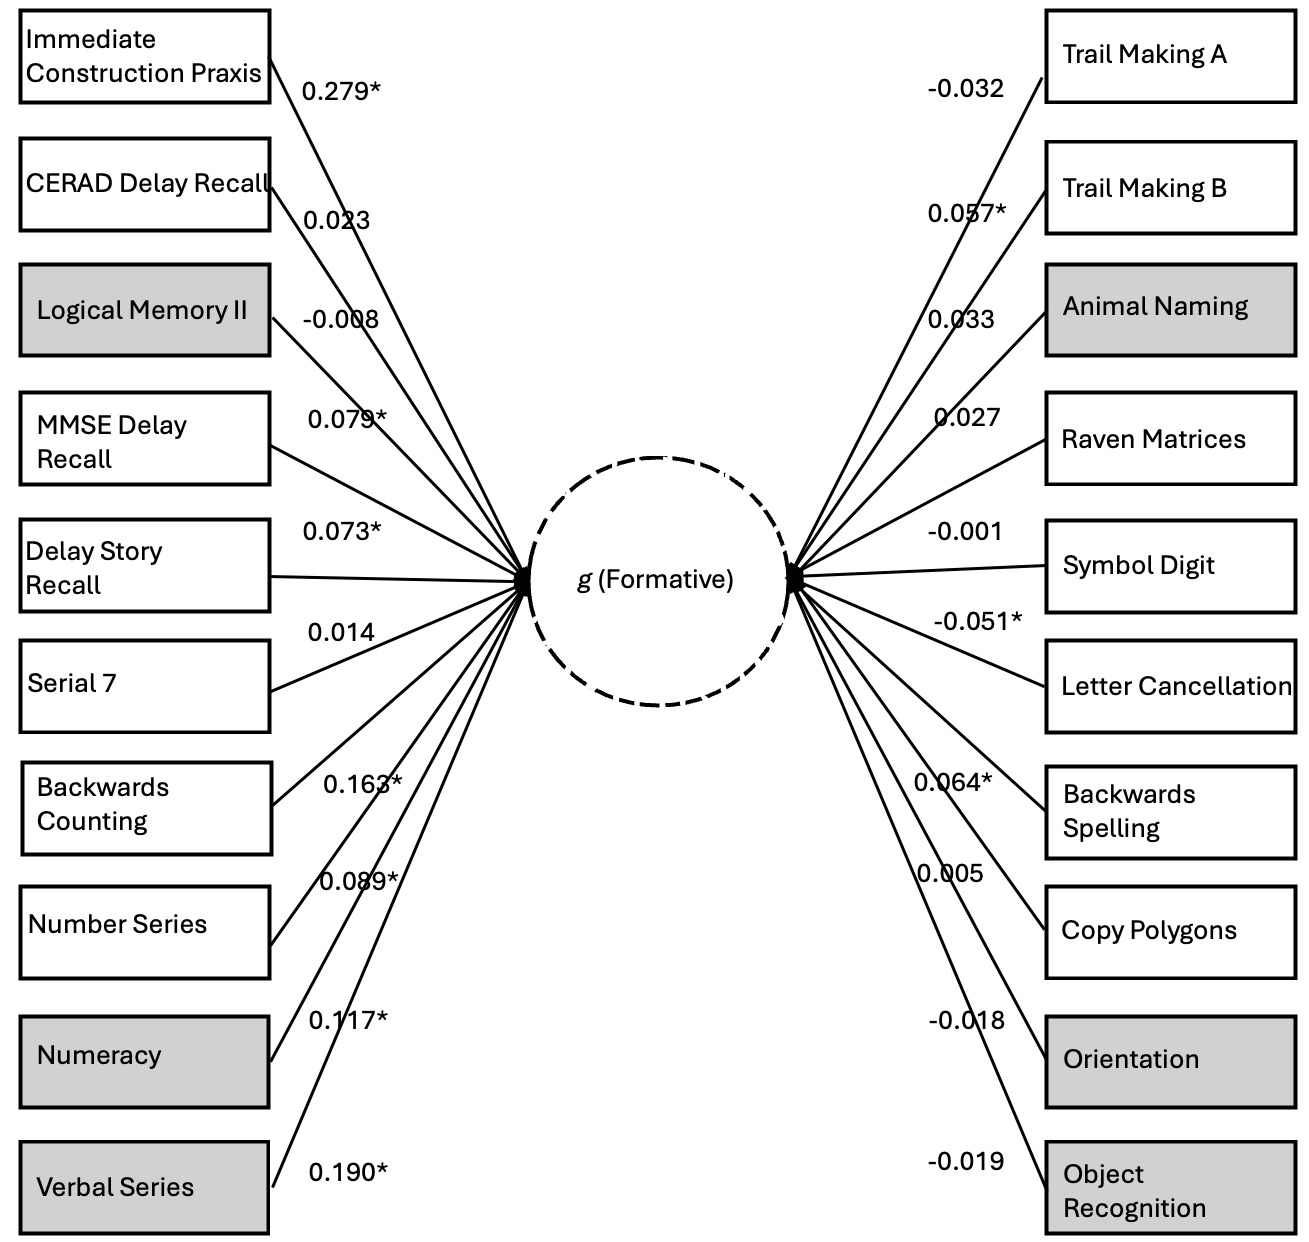
70% of the subtests exhibit positively signed loadings. The likelihood of this degree of sign consistency being a chance finding is low (p=.037). The positive manifold of the formative g factor includes subtests that span classic crystallized (e.g., Verbal Series), classic fluid (e.g., Matrix Reasoning), working memory (e.g., Serial 7), long-term memory (e.g., Delay Story Recall), coding speed (e.g., Digit Symbol), fluency (e.g., Animal Naming), and executive functioning (e.g., Trail Making), suggesting very substantial nomological breadth, consistent with the existence of a potentially distinct g factor, and not merely a narrower factor of some kind, e.g. a group factor. The contrast parameter for this unconstrained model is statistically significant (0.029, SE=0.014, p<.05). See the second Supplement (S2) for the full HCAP output associated with the unconstrained model.
Discussion
The successful tests of H1 and H2 employing Caemmerer et al.'s (2020) data establish the reality of the g paradox through conventional means, with the pattern of subtest-level (Stratum-I) g loadings indicating that the most g-loaded subtests are associated with the Gc group factor, which is also the most “culture-loaded” group factor. This pattern contrasts with that observed in the same data at the group factor level, with the Stratum-III g factor loading onto Gf more strongly compared to Gc (0.99 vs. 0.81). The difference in average subtest g loadings between Gc and Gf at Stratum I is numerically small (0.05) The theoretical importance of such effects, however, does not rest on their absolute magnitude, but on their direction, replicability (Kaufman et al., 2012), and structural inconsistency with standard hierarchical models. In a strictly reflective hierarchical model, this pattern is anomalous. Thus, even small systematic deviations are theoretically diagnostic because the null expectation is zero difference, not merely a small one.
The successful test of H3 indicates that subtests associated with Gc form a more robust network than do their Gf counterparts. This is a much stronger test of the g paradox, as network analysis constrains comparisons to interrelations among subtests at Stratum-I (latent variables are not permitted to form). These findings are consistent with the prediction that Gc subtests tap widely distributed brain networks which contribute to the formation of the Gc (Stratum-I g) “factor,” whereas single measures of Gf by contrast are unable to tap all the germane reflective factors (associated with Stratum-II g) simultaneously with sufficient depth, leading to poorer network characteristics.
The successful test of H4 is consistent with the idea that genetic influences on the positive manifold that are formative, that is, having direct effects on subtests independently of latent-variable-mediated paths, should exhibit stronger associations with subtests that are categorically associated with Gc. The random effects meta-analytic contrast parameter is 0.04 (p<.05). The unconstrained HCAP model also yields a significant contrast parameter in addition to signals of a nomologically broad potential formative g factor. When interpreting this result, it is important to keep Spearman’s sandwich (Figure 1) in mind. Recall that we are dealing with residual covariance (akin to that portion of the cheese that is not perfectly overlapped by the ham in the bird’s-eye view or straightforward latent-variable model, which is analogous to the hierarchical Stratum-II g). Owing to the strong overlap between the Stratum-I and Stratum-II gs, subtracting the “ham” layer leaves only the “edges” (residual covariance) of the cheese, hence we do not expect the signal of a truly formative g factor to have the same potency as the reflective g factor. Instead, the sign suggesting the presence of a distinct source of general covariance comes from the nomological characteristics of this residual covariance structure, which, as we demonstrate in the case of the unconstrained HCAP model, are suggestive of a broadly positive manifold (70% sign concordance) weakly integrating many types of ability measure. This evinces that we are not merely dealing with a narrower group factor—the formative g is indeed a g, but the effects associated with it appear weak as an artifact of the residualization needed to statistically detect it. The remaining negatively signed effects may, at least in part, reflect instability in estimating this structure, again as anticipated given the small magnitude of residual effect sizes.
A potential difficulty for our solution to the g paradox can be addressed given the results of testing H4. Specifically, we have argued at length for the different natures of the two gs, such that each is more strongly associated with specific kinds of cognitive abilities (crystallized vs. fluid). A natural objection is that if these sources of covariance differ in fundamental substantive organization, it is unclear how both can qualify as general. The answer is that—with a very small number of potential exceptions for, e.g., unusually narrow executive-functioning-type tasks (which, as per our theory, would of course favor the reflective g)—the variance of almost all subtests is expected to have some formative g and some reflective g component. For example, while working memory tasks may specially depend on relatively circumscribed neurological modules, formative effects on the overall integrity of the brain will impinge on the functioning of such modules. And reflective systems, such as those underlying attention, surely are involved in the learning processes through which crystallized intelligence is developed. Both formative and reflective g, then, are broadly involved in cognition and tasks demanding abilities exclusively in the domain of one or the other will be rare.
What forms Stratum-I g? A closer look
Miller (2000b, 2000a) has postulated a key role for weakly deleterious but pleiotropic mutations in the generation of the positive manifold. Such mutations would act in a formative manner through their parallel effects on a wide range of cognitive systems that (in their absence) would tend to be uncorrelated. Thus, individual differences in both the level and strength of intercorrelations among outward manifestations of formative g should give rise to a gradient of cognitive system integrity. They should moreover yield a larger global fitness factor consisting of pleiotropically mediated phenotypic correlations involving physical and reproductive characteristics too (such as height, physical abnormalities, sperm quality, etc.) on which selection can act via (social-sorting-mediated) mate choice and even possibly at the level of sperm selection (Arden, Gottfredson, & Miller, 2009; Arden, Gottfredson, Miller, et al., 2009; Pierce et al., 2009; cf. DeLecce et al., 2020).
Miller (2000b) observes that “[t]he method of correlated vectors … also shows that assortative mating is very focused on g-loaded mental traits. For example, spouses correlate more highly for their vocabulary sizes (a highly g-loaded trait) than they do for digit span (a modestly g-loaded trait)” (p. 264; emphasis added). Geary (2018, 2019) has identified a potentially critical mediating axis of system integrity in theorizing about a role for variation in mitochondrial numbers and efficiency in the generation of the positive manifold through their global effects on the regulation of cellular metabolism.
Furthermore, Miller (2000b) proposes that the reason that crystallized ability measures, such as vocabulary, are more (Stratum-I) g loaded and more heritable[11] is that they likely play a large role in conditioning human fitness in relation to social selection, since properly understanding and mentally and behaviorally managing group norms, communication systems (including language), and other culturally saturated phenomena would be key to social fitness (Miller’s emphasis is on sexual selection, a kind of social selection, whereas other social-selective processes are likely of greater importance—see Peñaherrera-Aguirre et al., 2023).
Crucially, we do not deny the potential for factors associated with enculturation, such as education, to contribute to the formation of Stratum-I g (as noted, Kan et al., 2011 suggest that there may be non-investment pathways through which cultural effects can generate covariance). We argue that, ultimately, however, individual differences in condition-dependent (especially deleterious-variant-related) features of the brain’s global processing networks are strongly determinative of the capacity to acquire knowledge. Compelling evidence to this end comes from Yeo, Ryman, Pommy, Thoma, and Jung (2016) who found that the g loadings among the subtests of a broad battery containing a Vocabulary measure positively moderated the magnitude of the subtest-by-total-cortical surface area (CSA) fluctuating asymmetry correlation. CSA fluctuating asymmetry is a broad index of neuro-developmental stability capturing the influence of, among other things, deleterious mutations. Thus, the most likely mechanism of general learning via Stratum-I g involves gene-environment correlation, with independent effects on covariance stemming from environmental-cultural variables likely playing a secondary role. Formal CFA analyses directly examining the role of subtests in mediating the effects of indices of mutations (or neuroanatomical proxies such as the aforementioned fluctuating asymmetry measure) on g should yield strong evidence for this claim.[12]
Finally, our solution to the g paradox has implications for the phylogenesis of the positive manifold. Stratum-I g may be primordial, and therefore highly phylogenetically conserved, being influenced by processes that globally regulate the activity of even very simple neural networks, such as those found in organisms lacking highly differentiated central nervous systems (see Peñaherrera-Aguirre et al., 2024 for relevant predictions concerning the presence of forms of primordial g in individual differences data on Caenorhabditis elegans). Stratum-II g, or the rudiments of it, by contrast, may have emerged in tandem with more complex and organized central nervous systems, such as those found in Arthropods, which appeared in the early Cambrian about half a billion years ago. Arthropod brains have the minimal neuro-cytoarchitectonic features necessary to accommodate more sophisticated forms of executive-functioning-type abilities or cognitive control systems—as such, Stratum-II g can be thought of as coordinating or integrating g given that such systems allow the regulation of the activity of lower-order networks and channels of inputs. The presence of mushroom bodies, which are found in the brains of certain Arthropods, for example, have been implicated in performance on reversal-learning tasks (Peñaherrera-Aguirre et al., 2024). A greater elaboration on these more primitive structures would have given rise to the more robust suite of cognitive entities that can be readily identified as corresponding to Stratum-II g in mammalian intelligence. In light of the foregoing, we propose a new nomenclature for the two gs: proto g for the Stratum-I g, and neo g for the Stratum-II g; these can be denoted gp and gn.
Limitations
While the CHC model is very widely accepted among psychometricians, it has its detractors, most notably proponents of the g-VPR (Verbal Perceptual Rotation) model (e.g., Johnson & Bouchard, 2005), who would doubtlessly object to our reliance on the Gc/Gf distinction here. It is possible that what we are claiming are two distinct gs may have an analogue in the g-VPR model context.
It might be that there are additional distinct sources of covariance at play, perhaps working through other CHC group factors—in particular, the degree to which the group factors of short-term memory and processing speed in the CHC model are reflective and/or formative entities, and how they relate to the full empirical reality of fluid ability (e.g., to what extent short-term, especially working, memory and processing speed are subsumed under fluid ability in reality, with the CHC short-term memory and processing speed factors possibly corresponding to more specialized aspects of these dimensions of cognition) are matters that require further investigation. In this vein, it is worth considering research providing evidence that “cognitive processing speed” and “cognitive processing accuracy” have discriminable neurological and genetic bases (Li et al., 2024). As it stands, the evidence presented through Analysis 1 suggests that the “fluid” and “crystallized” sources of general covariance are the primary ones, such that a two-gs model is adequate. But future lines of research could be developed to test these possibilities.
It must be appreciated that this work has had little to say about the g paradox at the level of developmental psychology. As noted in the Discussion, the theory of the evolution of gp and gn entails that, while the former emerged earlier in phylogenetic time, the rudiments of the latter are likely present in Arthropods and therefore may have existed in some form in animal taxa for around half a billion years (see predictions in Peñaherrera-Aguirre et al., 2024). The g paradox thus should be a manifestation of basic structural features of the human brain with deep evolutionary histories, so basic that it should be detectable across the life course (rather, from the point in the life course at which both fluid and crystallized intelligence can be reliably measured and on). Indeed, we have successfully tested predictions derived from our model in both child and adult samples in the current article. Still, there is undoubtedly much research to perform in the future to elucidate how the g paradox appears in human ontogeny. The current authors plan in a set of analyses for a future publication to test for the presence of the paradox in child and adult samples, using covariance matrices derived from Woodcock-Johnson I-III standardization data.
Acknowledgments
The authors would like to thank Jacqueline Caemmerer for kindly providing the covariance matrices used in the paper of Caemmerer et al. (2020) for reanalysis here. AJ Figueredo and three anonymous reviewers offered feedback that substantially improved this article. MIDUS is supported by multiple grants from the National Institute on Aging (5R37AG027343, 5P01AG020166, 1R03AG046312, 1U19AG051426) and also by the University of Wisconsin Institute on Aging.
Funding
None of the authors received external funding to conduct this research. ELSA is funded by the National Institute on Aging (R01AG017644), and by UK Government Departments coordinated by the National Institute for Health and Care Research (NIHR). The HRS (Health and Retirement Study) and HCAP (Harmonised Cognitive Assessment Protocol) are sponsored by the National Institute on Aging (NIA U01AG009740) and is conducted by the University of Michigan.
Competing interests
The authors declare no financial interests in the outcome of this work.
Ethics statement
All analyses were based on publicly accessible databases that did not require special application or an IRB review.