


In most Western, wealthy countries, women now outnumber men in higher education but are still underrepresented in many inorganic science, technology, engineering, and mathematics (STEM) fields, such as physics and computer science (Lippa et al., 2014; Stoet & Geary, 2018, 2020b). The causes of this disparity are a source of debate (Ceci et al., 2009) and have been attributed to both biologically influenced factors, such as sex differences in occupational interests (Berenbaum, 1999; Stoet & Geary, 2022; Su et al., 2009) and spatial abilities (Halpern et al., 2007), as well as social-cultural factors, such as stereotypes and socialization practices (Eddy & Brownell, 2016). Sex differences in intraindividual academic strengths have recently emerged as another significant contributing factor (Balducci, 2023). These refer to a student´s best academic subject (mathematics, reading, or science), irrespective of their overall academic achievement.
The argument follows from expectancy-value theory (Eccles, 1983), whereby students’ comparative advantage (i.e., intraindividual academic strengths) influences educational choices (Bernstein et al., 2019). In this framework, ‘expectancy’ refers to the perceived likelihood of performing well in subjects like mathematics, reading, and science, while ‘value’ pertains to the anticipated long-term benefits of engaging with these subjects. Consequently, students with relatively stronger mathematics or science than reading abilities would be more likely to enroll in STEM fields in college, as they expect to excel in them. On the other hand, their peers with relatively better reading than mathematics and science abilities would be more likely to enroll in the humanities or social science fields. This prediction is supported by large-scale longitudinal studies in the United States (Humphreys et al., 1993; Wang & Degol, 2013) and Sweden (Dekhtyar et al., 2018). The prediction is also particularly relevant for high-achieving students due to the academic requirements of STEM fields (Bernstein et al., 2019) and in developed, gender-equal countries where individuals have the freedom to follow their preferred educational paths irrespective of the anticipated long-term financial returns of pursuing STEM as compared to non-STEM degrees (Siy et al., 2023; Stoet & Geary, 2018).
The most relevant pattern related to sex disparities in STEM fields is that girls and women tend to have intraindividual strengths in reading (i.e., stronger reading than mathematics and science) while boys and men tend to have intraindividual strengths in mathematics or science (Park et al., 2007; Stoet & Geary, 2018). In line with the gender equality paradox – i.e., many sex differences are larger in gender-equal countries (Halsey & Geary, 2025; Herlitz et al., 2024) – sex differences in intra-individual strengths also appear to be larger in more gender-equal countries (Balducci et al., 2024).
However, most studies to date have used an average performance approach, making it unclear whether the same sex differences and the gender equality paradox are present among students at the highest and lowest levels of achievement. In fact, the gender equality paradox might be more relevant for high-achieving students, given the cognitive demands of STEM fields. This is because STEM fields typically require high intellectual engagement and tend to attract students from the upper end of the cognitive performance distribution (Wai, Cacchio, et al., 2010; Wang et al., 2017). If the gender equality paradox is more pronounced among high-achieving students, it would signal that proportionately fewer women might be inclined to enter STEM fields based on their intraindividual strengths in gender-equal societies.
Advantages of using an intraindividual strength approach
A student’s overall performance in mathematics, reading, and science plays a significant role in their long-term occupational choices but may be less influential than their ability tilt—that is, the difference between two cognitive domains, such as reading versus mathematics. Stoet and Geary (2018) showed that fewer women were entering inorganic STEM career paths than expected based solely on their overall mathematics performance, and that part of the gap was explained by fewer women than men having an intraindividual strength in mathematics or science. Further, Park et al. (2007) highlighted that while overall performance in adolescence is associated with increased odds of distinguished accomplishments in adulthood, the specific domain of achievement was related to ability tilt. Individuals with higher mathematical than verbal abilities were more likely to be distinguished in STEM fields, whereas those with higher verbal than mathematical abilities were more likely to be distinguished in humanities fields.
While ability tilts might be more indicative than overall academic performance, they still fail to capture the intraindividual strengths that expectancy-value theory predicts have the most influence on educational and occupational choices. Intraindividual academic strengths reflect ability tilts while also accounting for overall academic achievement. Specifically, an ability tilt subtracts one domain from another, such as reading minus mathematics, while intraindividual strengths assess deviation from expected scores based on overall levels of academic achievement (see Methods). Having an intraindividual strength in mathematics, for example, means that performance is higher in mathematics than what would be expected based on overall achievement levels and as compared to reading and science, not just better mathematics than reading.
Expected patterns in intraindividual strengths
Previous research on sex differences in intraindividual strengths has focused on mean scores, leaving unanswered whether the same differences are present at varying levels of achievement. This gap in the literature calls for an incremental study that builds on prior research on intraindividual strengths and grounds its predictions in studies using similar measures (e.g., Esposito et al., 2025).
In this vein, it has been shown that sex differences in overall mathematics and reading performance are inversely related within countries (Guiso et al., 2008; Stoet & Geary, 2013). In other words, countries with larger overall sex differences in mathematics have smaller overall sex differences in reading, and vice versa. This could suggest that larger sex differences in mathematics as an intraindividual strength are associated with smaller sex differences in reading as an intraindividual strength.
Further, focusing on the performance distribution, Stoet and Geary (2013) found that at the 95th percentile of mathematics achievement, there were 1.7-to-1.9 boys for every girl (across countries) and this increased to 2.3-to-2.7:1 at the 99th percentile. Similarly, Makel et al. (Makel et al., 2016) found that boys and men were overrepresented by about three to one (2-to-4:1) among top (e.g., top 1 to 5%) mathematics and science performers, whereas girls and women were overrepresented by about three to one at the high end of verbal abilities. In line with these studies, Wai et al. (2018) examined ability tilts in more than 2 million gifted adolescents and observed that the magnitude of the sex difference in this tilt (boys towards mathematics and girls towards reading) increased with increases in overall academic attainment (e.g., top 1% vs. top 5%). Given these patterns, it is possible that sex differences in intraindividual strengths are larger for high-achieving students than their average-achieving peers.
Current study
In this preregistered incremental study, we used data from 1.6 million adolescents across more than 80 countries and three (2012, 2015, and 2018) waves of the Programme for International Student Assessment (PISA) to examine: sex differences in mathematics, reading, and science as intraindividual strengths at different levels (high, intermediate, and low) of overall PISA achievement (Objective 1); whether countries in which boys have relatively larger intraindividual strengths in mathematics or science have a relatively smaller intraindividual strength for girls in reading (Objective 2); and, the association between sex differences in intraindividual strengths and the Global Gender Gap Index (GGGI) from the World Economic Forum at different levels of PISA achievement (Objective 3). In line with these objectives, we formulated and registered the hypotheses shown in Table 1.
Method
Study design and sample
We analyzed intraindividual academic strengths at different levels of academic achievement and their relations with gender equality using data from the Programme for International Student Assessment (PISA). We focused on three recent waves: 2012, 2015, and 2018. The 2022 PISA assessment was not considered because of cross-national differences in COVID-related restrictions on school attendance that might compromise the validity of country-level comparisons.
The number of participating countries or economic regions (e.g., Hong Kong) varied from 64 in PISA 2012 to 77 in PISA 2018. To prevent double-counting, we excluded regions for which related national data were also available, that is, Perm (Russia) in PISA 2012; several Spanish regions, Massachusetts, and North Carolina (US) in PISA 2015; and Moscow and Tatarstan (Russia) in PISA 2018.
The final sample included 1,611,512 adolescents from 74 countries, as well as 8 regions for which whole-country data were not available. These included Buenos Aires (PISA 2015), Hong Kong, Macao, and Chinese Taipei (Taiwan) in all three PISA waves. China participated in PISA in 2012 but only with Shanghai, and then added Beijing, Jiangsu, and Guangdong in PISA 2015 and 2018. All Chinese provinces were aggregated by PISA (see S1 Table for a complete list). Note that Viet Nam (PISA 2018) and Kosovo (PISA 2015 and 2018) were not included because of incomplete data sets.
Measures
Programme for International Student Assessment
PISA is a global educational evaluation conducted triennially by the Organization for Economic Cooperation and Development (OECD). It targets high school students (age range: 15 years, 3 months to 16 years, 2 months), and assesses their proficiency in mathematics, reading comprehension, and science literacy.
PISA utilizes a two-stage sampling approach. First, a sample of schools for each participating country is selected, accounting for regional diversity. Within each school, students are then randomly chosen to ensure representation of the target population. Next, selected students are assigned one of several sub-questionnaires covering all three academic areas for a two-hour assessment.
The primary PISA objective is to draw inferences about the target population and thus prioritize country-level academic assessments over individual performance (OECD, 2009). To achieve unbiased estimates, student competencies in mathematics, reading comprehension, and science literacy are derived from a set of plausible values (PVs). These are random values generated from the posterior distribution of actual test scores, reflecting the same latent distribution of measured academic skills. Based on the Rasch Model, PVs are scaled to set the mean for OECD countries at 500 points with a standard deviation of 100.
There were several notable cross-wave methodological changes in PISA. In 2012, 5 PVs were provided, but this increased to 10 PVs from 2015 onward. Starting in 2015, a computer-based format was implemented in most participating countries, replacing the traditional paper-based format. This new format does not permit students to revisit questions once they have answered or skipped them. Additionally, the 2018 reading comprehension assessment introduced a novel two-stage adaptive testing approach: Students were first evaluated with a core set of questions and then, based on their initial performance, administered a follow-up test with either more or less difficult questions.
Global Gender Gap Index
Since 2006, the Global Gender Gap Index (GGGI) has been released annually by The World Economic Forum (WEF). The GGGI uses 14 key indicators to assess a country’s progress towards gender equality across four key domains: Economic Participation and Opportunity, Educational Attainment, Health and Survival, and Political Empowerment. Each indicator is rated on a scale from 0 to 1, where a score of 1 indicates either perfect gender parity or men falling behind. The GGGI includes more than 140 nations to date (World Economic Forum, 2023).
The GGGI was specifically designed to identify disparities in the participation of women and men in the four key domains at the national level, and thus guide public policies aimed at addressing these disparities (Hausmann et al., 2009). Nevertheless, it has faced criticism for not directly assessing the most academically significant subdomains of gender equality, such as the percentage of women in research (Else-Quest et al., 2010), and for not addressing challenges encountered by boys and men (Stoet & Geary, 2019). Some critics also argue that the GGGI simplifies the concept of gender equality and advocate for the use of more domain-specific indices (e.g., earned income, proportion of executive positions) (Else-Quest & Grabe, 2012). While GGGI sub-facets or specific indicators might be useful in certain contexts, the overall GGGI scores provide a more comprehensive picture of attitudes toward gender equality and opportunities that could affect freedom of choice in many domains of life for both men and women at the national level. Further, alternative measures (Stoet & Geary, 2019) are also useful at times, but these generally do not account for many economic and political disparities that are integral components of the GGGI. Lastly, specific indicators or other measures are likely only available for a limited number of countries. For these reasons, we concluded that the GGGI better represents overall national levels of gender equality than individual sub-facets, specific indicators, or alternative measures, and it also covers a significantly wider range of countries.
In our sample, the GGGI scores varied from 0.593 for Jordan in PISA 2012 to 0.881 for Iceland in PISA 2015 and were stable across waves (rs = > .85). For the gender equality analyses, we excluded countries without GGGI scores or those whose assessments were based solely on regional or municipal samples. For the latter, regional GGGI values (when available) may not accurately reflect national levels of gender equality. Consequently, our final GGGI samples ranged from 57 countries in PISA 2012 to 71 countries in PISA 2018 (see S2 Table).
Analysis
All analyses were conducted using the statistical software STATA 18 and closely followed the guidelines for analyzing PISA data (OECD, 2009). We applied an alpha criterion of .05. Based on the preregistered methodology, a three-step approach was employed to prepare the data for hypothesis testing. The first was the calculation of overall PISA achievement for each participant (1st step). Then we computed, again for each participant, their intraindividual strength (2nd step). Finally, at the country level, we calculated sex differences in intraindividual strengths (3rd step).
PISA achievement (1st step)
We used PVs to determine each participant’s overall PISA achievement. We first computed the mean performance across the three academic subjects and used these to create new PVs to represent mean PISA achievement. Next, these mean performance scores were standardized on a country-by-country and wave-by-wave basis (i.e., M = 0, SD = 1 for each country in each PISA wave). The new standardized mean was named zGeneral. The procedure was carried out for all PVs (5 for PISA 2012, 10 for PISA 2015 and 2018) before averaging the results (OECD, 2009).
Computing intraindividual strengths (2nd step)
We identified participants’ highest, second-highest, and lowest academic competence based on PVs for Mathematics, Reading Comprehension, and Science Literacy following the procedure outlined in Stoet and Geary (Stoet & Geary, 2018); again, the analysis was performed separately for each PV before averaging the results (OECD, 2009). Data were first standardized by country and PISA wave such that each academic area had a mean of 0 and an SD of 1 within each country. The results were standardized scores for each academic domain, i.e., zMath, zReading, and zScience. Intraindividual strengths were estimated as the difference between the academic z scores and zGeneral (computed in the 1st Step). For example, the intraindividual mathematics strength equals zMathz - zGeneral. This procedure was replicated for zReading and zScience. The average intraindividual performance in mathematics, reading comprehension, and science literacy was computed for both boys and girls for each country and PISA wave.
It is important to note that Plausible Values (PVs) should not be used to derive individual-level scores, as they are specifically designed to generate reliable country-level measures. This is precisely why the aforementioned multi-step approach was preferred.
Sex differences in intraindividual strengths (3rd step)
In the final step, we calculated sex differences in intraindividual strengths at different levels of overall PISA achievement for each country. Following the approach used in the study of ability tilts (Wai et al., 2018), our sample was divided into three levels according to overall PISA achievement: high achievers = top 5 percent (95th percentile and above, inclusive); low achievers = bottom 5 percent (5th percentile and below, inclusive), and intermediate achievers (> 5th to < 95th percentile). At each achievement level, sex differences in intraindividual strengths were then computed for each country by subtracting boys’ scores from those of girls. To ensure the robustness of the results, we also performed the last three steps using a 10th percentile cut-off (i.e., top 90 percentile and bottom 10 percentile).
Of note, our achievement levels differ from the PISA proficiency level (OECD, 2009). Our achievement levels consider overall PISA performance when assessing intraindividual strengths. On the other hand, PISA proficiency levels focus separately on mathematics, reading, and science and would not allow for a direct comparison of intraindividual strengths. Additionally, proficiency levels use different cut-offs depending on the specific skill being evaluated.
Analytical strategy
Objective 1. As detailed earlier, sex differences were computed at the country level and for the three PISA achievement levels. Then, on a wave-by-wave basis, we compared mean sex differences for mathematics, reading comprehension, and science literacy as intraindividual strengths for each achievement level using an Analysis of Variance (ANOVA) for independent samples to assess statistical differences across these levels. In addition, utilizing the student weights, we calculated the relative ratio (girls to boys) and percentages of girls and boys having either mathematics, reading comprehension, or science literacy as an intraindividual strength at each PISA achievement level and for each wave.
Objective 2. Using the sex differences at the country level computed in the 3rd step, we correlated (Spearman’s ρ) sex differences in mathematics as an intraindividual strength with sex differences in reading comprehension as an intraindividual strength. Then, we repeated the same procedure for sex differences in science and reading as intraindividual strengths, and mathematics and science as intraindividual strengths.
Objective 3. We used both Spearman’s ρ correlation (rs) and Ordinary Least Squares (OLS) to examine the relation between sex differences in intraindividual strengths and GGGI at different levels of PISA achievement. For the OLS, we used regression models with a bootstrap method involving 1,000 iterations, as represented by the formula:
\[{SG}_{Cp} = \alpha_{1}M_{c} + \varepsilon_{c},\]
where denotes the magnitude of the sex difference in mathematics, reading comprehension, or science literacy as an intraindividual strength in country c at a specific level of PISA achievement p, while represents the GGGI score for country c.
Supplementary analysis
We conducted the same analysis using an alternative strategy, where, rather than dividing our sample by averaging the zGeneral in the first step, we performed the analysis separately for each zGeneral across PVs and then averaged the results at the end. Importantly, we found nearly identical results and therefore chose to present the findings based on the initial method, as it aligns with the preregistered approach.
Results
The results are presented in three sections focusing on: sex differences in intraindividual strengths; correlations among sex differences in intraindividual strengths; and relations between sex differences in intraindividual strengths and GGGI scores. Only results for the 5th percentile achievement cut-offs (high, intermediate, and low) are presented. Replications of the analyses using the 10th percentile cut-offs are in the supplementary material. Of note, while this study examines sex differences, these differences reflect the collective of unique students. Therefore, the results are not designed to inform about single individuals, whose personal patterns may deviate from the broader trend.
Sex differences in Intraindividual strengths
Mathematics
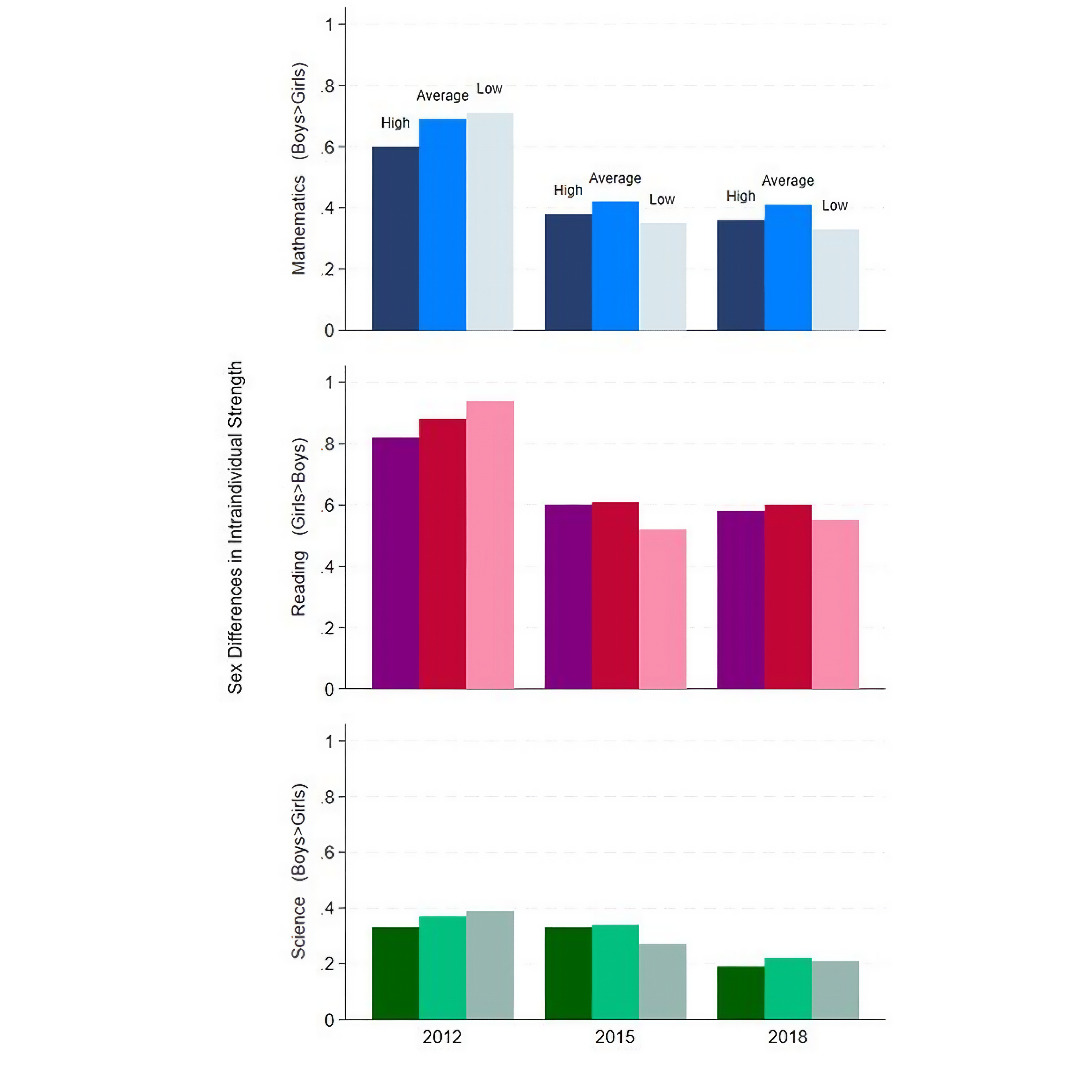
The results show that mathematics is more likely to be an intraindividual strength for boys than girls at every wave and each level of PISA achievement (Fig. 1, top panel). In PISA 2012, the trend was more pronounced among low than intermediate and high achievers. However, in PISA 2015 and 2018, the largest sex differences were among intermediate achievers, although the magnitude of these sex differences was similar across achievement levels.

The largest sex difference for mathematics as an intraindividual strength, 0.71 SDs (95% CI = [0.66, 0.76], p < .001), was observed for low achievers in PISA 2012, whereas the smallest, 0.33 SDs (95% CI = [0.30, 0.37], p < .001), was observed among low achievers in PISA 2018. Post-hoc ANOVAs showed sex differences were statistically significantly larger for low than high (Contrast = 0.11 SDs) and for intermediate than high (Contrast = 0.09 SDs) achievers in PISA 2012. In PISA 2015, the differences were larger for intermediate than low achievers (Contrast = 0.07 SDs), and larger for intermediate than high (Contrast = 0.05 SDs) and for intermediate than low (Contrast = 0.07 SDs) achievers in PISA 2018.
Across countries, sex differences in mathematics as an intraindividual strength consistently favored boys for each wave and at each level of PISA achievement. The only exceptions were found in China among low achievers in 2015 and in the Philippines among low achievers in 2018. In both cases, we find sex parity.
Reading
Girls’ advantage for reading as an intraindividual strength was found for every PISA wave and achievement level (Fig. 1, mid panel). Sex differences were largest either among high or intermediate achievers, depending on the PISA wave. The magnitudes of girls’ advantage tended to decrease from 2012 to 2018 at every achievement level but remained significant. Coefficients ranged from -0.94 SDs (95% CI = [0.88, 1.00], p < .001) for low achievers in PISA 2012 to -0.52 SDs (95% CI = [0.48, 0.56], p < .001) for low achievers in PISA 2015. Post-hoc ANOVAs revealed significantly larger sex differences for low than high achievers (Contrast = 0.12 SDs) in PISA 2012; larger sex differences for high than low (Contrast = 0.08 SDs) and intermediate than low achievers (Contrast = 0.09 SDs ) in PISA 2015; and larger sex differences for intermediate than low achievers (Contrast = 0.05 SDs) in PISA 2018.
In line with a substantial advantage of girls in this domain, we did not find a single country where sex differences favored boys at any level of PISA achievement. In other words, sex differences in reading as an intraindividual strength were universal across countries, PISA waves, and achievement levels.
Science
Boys’ advantage for science as an intraindividual strength was found in every PISA wave and achievement level (Fig. 1, bottom panel). The largest sex difference emerged among low achievers in PISA 2012 (0.39 SDs, 95% CI = [0.35, 0.43], p < .001), and the smallest among high achievers in PISA 2018 (0.19 SDs, 95% CI = [0.16, 0.21], p < .001). Post-hoc ANOVAs showed that the sex differences were statistically larger only for intermediate than low (Contrast = .07) achievers in PISA 2015. No other contrasts were significant, suggesting that, in general, boys’ advantage remains stable across achievement levels.
Overall, boys’ advantage in science as an intraindividual strength was near universal; that is, found in almost all countries, PISA waves, and achievement levels, with only a few exceptions. We found sex parity in Chile and Liechtenstein for low achievers, in Albania for intermediate achievers, and in Argentina and Brazil for high achievers, in PISA 2012; in the U.K., Croatia, Montenegro, Slovakia, and Trinidad and Tobago for low achievers, in Lebanon and Romania for intermediate achievers and in the United Arad Emirates, North Macedonia, and Malta for high achievers in PISA 2015; in Albania, Brazil, Germany, Dominican Republic, Georgia, Jordan, Lebanon, Qatar, Romania, and the U.S. for low achievers, and the United Arab Emirates, Luxembourg, the Netherlands, Panama, and Saudi Arabia for high achievers in PISA 2018. Additionally, a slight advantage for girls emerged in all PISA assessments for high achievers in Jordan (-0.11 to -0.15 SDs); and in PISA 2018 for low achievers in Malta (-0.15 SD), and Turkey (-0.10 SD).
Relative Ratio
Analyzing the relative ratios of boys and girls with mathematics, reading, or science as an intraindividual strength is another way to understand the above patterns. The ratios depict the number of girls to boys with either mathematics, reading, or science as their main intraindividual strength, irrespective of the magnitude of the sex differences in these strengths.
For mathematics, the ratio favored boys in every wave and at every PISA achievement level. Among high and intermediate achievers, the overall (across countries and waves) ratio was about two boys for every girl, but this was 3:1 among low performers. This means that the ratio is generally more skewed among low achievers and becomes less pronounced as achievement level increases. The one exception was for PISA 2018, where the ratio was the smallest among intermediate achievers, although boys were still more favored among low than high achievers. In sum, there are 2 to 3 boys for every girl with mathematics as their intraindividual strength, depending on the level of PISA achievement. Across countries, the ratio favored boys the most among low achievers in Jordan (25 boys for every girl) in PISA 2012, while it favored girls the most among high achievers in Thailand (1.89 girls for every boy) again in PISA 2012.
For reading as an intraindividual strength, a similar pattern emerged but favoring girls at every wave and level of PISA achievement. The ratios ranged between 10.31 girls for every boy for high achievers in PISA 2012, to 1.53 girls for every boy for low performers in PISA 2018. Notably, the ratio of girls to boys decreased from high to low PISA achievement levels, but it remained substantive. There appears to be a slight reduction across waves in this ratio, possibly due to changes in the PISA format (see Discussion). Across countries, the pattern resembles the one found for mathematics. There were very few countries where the ratio favored boys. Most notably, there were three boys for every girl with reading as an intraindividual strength among low achievers in Qatar in PISA 2018. At the other extreme, there were 192 girls for every boy among high achievers in Thailand in PISA 2012.
There were more boys than girls with science as an intraindividual strength across achievement levels and waves, although the magnitude of these ratios was smaller than those found for mathematics and reading. Overall, there were 1.37 boys (range between 1.15 in PISA 2012 to 1.54 in PISA 2018) for every girl among high achievers, 1.53 boys (range between 1.41 in PISA 2018 to 1.61 in PISA 2015) for every girl among intermediate achievers, and 2.13 boys (range between 1.96 in PISA 2015 to 2.22 in PISA 2018 and 2012) for every girl among low achievers. Although some fluctuations among high achievers occur, the ratio was generally stable across PISA waves and at each level of achievement. Across countries, the largest advantage (14:1) for boys was among lower achievers in Qatar in PISA 2012, whereas there were 4.41 girls for every boy among high achievers in Jordan in PISA 2012. However, we found only a few countries where the ratio favored girls (see S5 Table).
Percentages
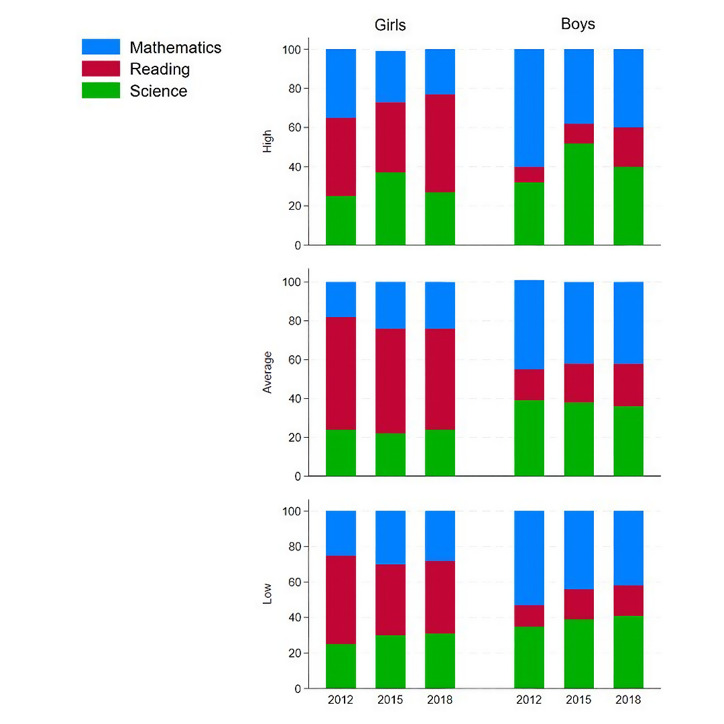
The same patterns can be shown by focusing on the percentage of boys and girls who had mathematics, reading, or science as their main intraindividual strength at each level of PISA achievement (Fig. 2).

Specifically, among high achievers, mathematics was the intraindividual strength for 28% of girls (range: 23%-35% across countries and waves), as compared to 42% and 30% for reading (range: 37%-50%) and science (range: 25%-37%), respectively. In contrast, mathematics was the intraindividual strength for 46% of boys (range: 39%-61%), reading for only 13% (range: 8%-20%), and science for 41% (range: 32%-51%).
For intermediate achievers, 22% of girls (range: 18%-24%) had mathematics as their intraindividual strength, while 55% and 23% had reading (range: 52%-58%) and science (range: 22%-25%), respectively. The corresponding values for boys were 43% for mathematics (range: 42%-45%), 19% for reading (range: 16%-22%), and 38% for science (range: 36%-39%).
Among low achievers, 28% of girls had mathematics as their intraindividual strength (range: 25%-30%), 44% (range: 40%-50%) had reading and 28% had science (range: 25%-31%). In contrast, 46% (range: 42%-53%) of boys had mathematics as their main intraindividual strength, as compared to 16% and 38% for reading (range: 12%-18%) and science (range: 35%-41%), respectively.
To put this into perspective, we computed the relative percentage differences between boys and girls for each intraindividual strength and level of PISA achievement. Across waves, there were 52%, 80%, and 48% more boys than girls with mathematics or science as their main intraindividual strength across high, intermediate, and low-achieving students, respectively. At these same achievement levels, there were 231%, 189%, and 175% more girls than boys with reading as their main intraindividual strength.
Correlations among sex differences in intraindividual strengths
To test our second set of hypotheses, we examined correlations between intraindividual strengths across countries, PISA achievement levels, and waves. Positive correlation coefficients indicate that as sex differences in intraindividual strength in one domain increase, they also increase in the contrasting domain. Conversely, negative correlation coefficients suggest that as sex differences in intraindividual strength increase in one domain, they decrease in the contrasting domain.
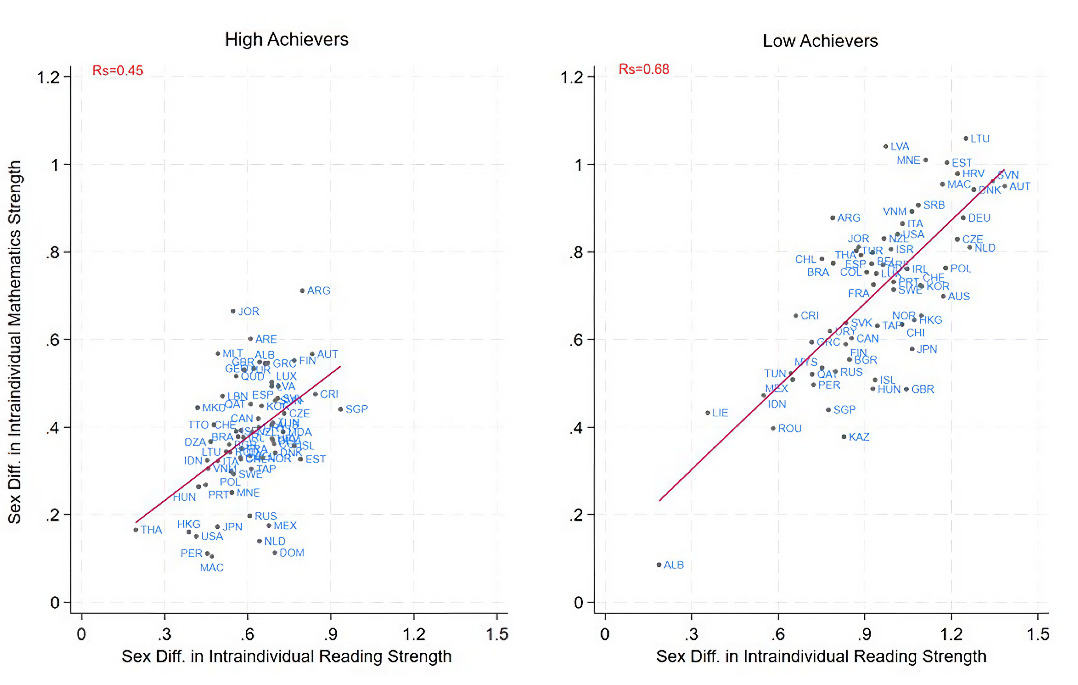
We began with an examination of the correlation between sex differences in mathematics and reading as intraindividual strengths (Fig. 3). Across countries and achievement levels, as boys’ advantage in mathematics as an intraindividual strength increased so did girls’ advantage in reading as an intraindividual strength. The correlation was smallest among high achievers in PISA 2015 (rs = 0.45, 95% CI = [.24, .65], p < .001, n = 69), and was most pronounced among low achievers in PISA 2012 (rs = 0.68, 95% CI = [.52, .84], p < .001, n = 64). Despite some fluctuations, this relationship remained relatively stable across different PISA waves and achievement levels.
We found a similar pattern for the relation between sex differences in reading and science as intraindividual strengths. The magnitude of this relation declined across waves and at every PISA achievement level, but the correlations remained significant. Specifically, the correlations ranged from rs = 0.22 (95% C.I. = [.02, .43], p < .001, n = 77) among high achievers in PISA 2018 to rs = 0.64 (95% C.I. = [.48, .79], p < .001, n = 64) among intermediate PISA achievers in 2012.
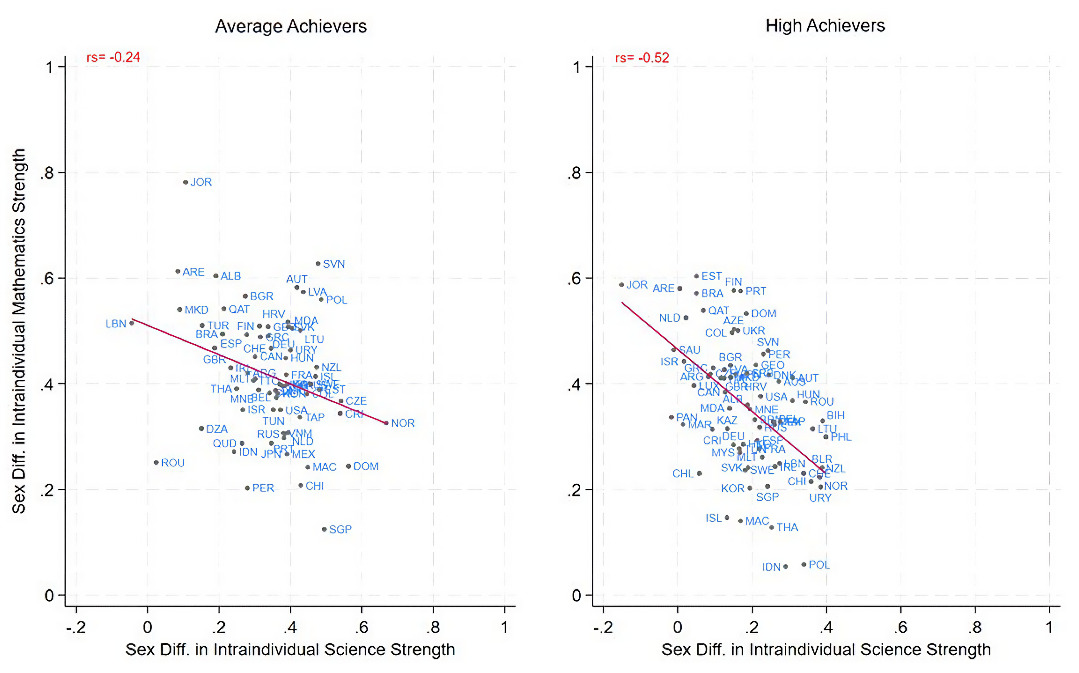
Interestingly, we found a negative correlation between sex differences in mathematics and science as intraindividual strengths at the country level (Fig. 4). This trend was most notable and consistent among high achievers throughout all three waves, with coefficients ranging from rs = -0.24 (95% C.I. = [-.50, .02], p = .05, n = 69) for intermediate achievers in PISA 2015 to rs = -0.52 (95% C.I. = [-.68, -.36], p < .001, n = 77) for high achievers in PISA 2018 (Fig. 3). Note that the correlation was not significant among intermediate and low achievers in PISA 2012.
Gender Equality Paradox
In line with previous studies (Balducci et al., 2024; Stoet & Geary, 2018) and the preregistered hypothesis, there was no relation between sex differences in mathematics as intraindividual strength and GGGI scores across PISA waves or achievement levels. However, a relation did emerge for reading and science as intraindividual strengths at every wave and most achievement levels. In other words, sex differences in reading and science, as intraindividual strengths at different levels of PISA achievement, were larger in countries with higher gender equality.
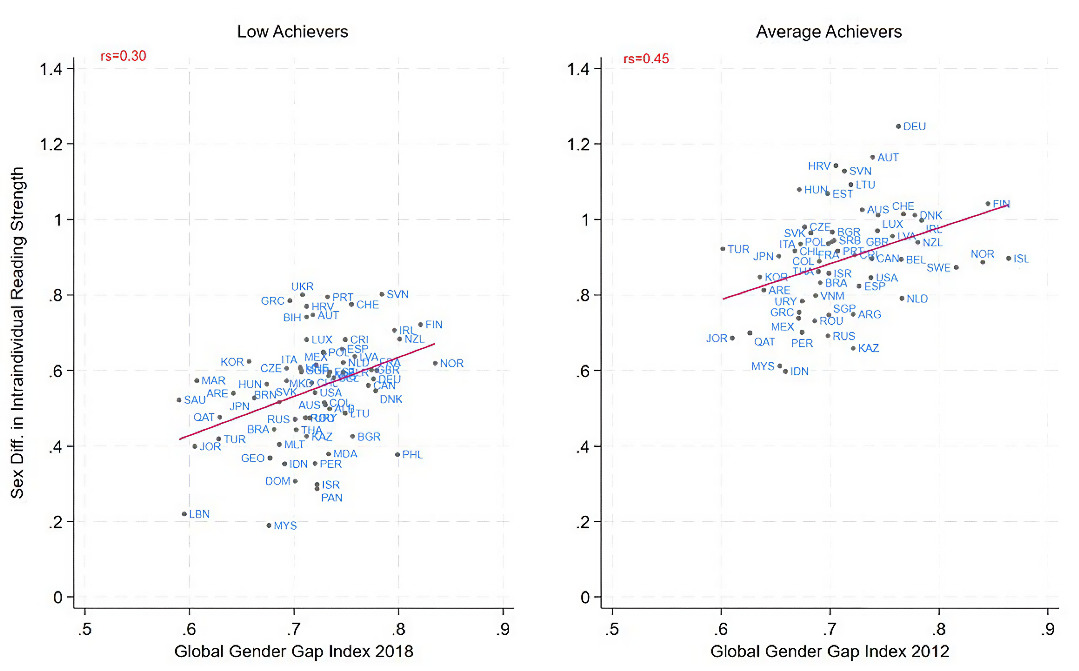
Countries with higher GGGI scores showed larger girls’ advantages in reading as an intraindividual strength (Fig. 5). The correlations were generally significant across waves and achievement levels, except for low performers in PISA 2015 and intermediate and high performers in PISA 2018. The significant correlations ranged from rs = 0.30 (95% C.I. = [0.25, 0.65], p < .001, n = 69) for low PISA achievers in 2018 and rs = 0.45 (95% C.I. = [0.25, 0.65], p < .001, n = 57) for intermediate achievers in 2012. The marginal results for PISA 2018 appeared to be due to Iceland and Sweden as outliers. Removing Iceland resulted in a pattern in line with a gender equality paradox for intermediate achievers (rs = 0.25, 95% CI = [.04, .47], p = .02, n = 69); the same held for high achievers when removing both countries (rs = 0.24, 95% C.I. = [.02, .47], p = .04, n = 68).
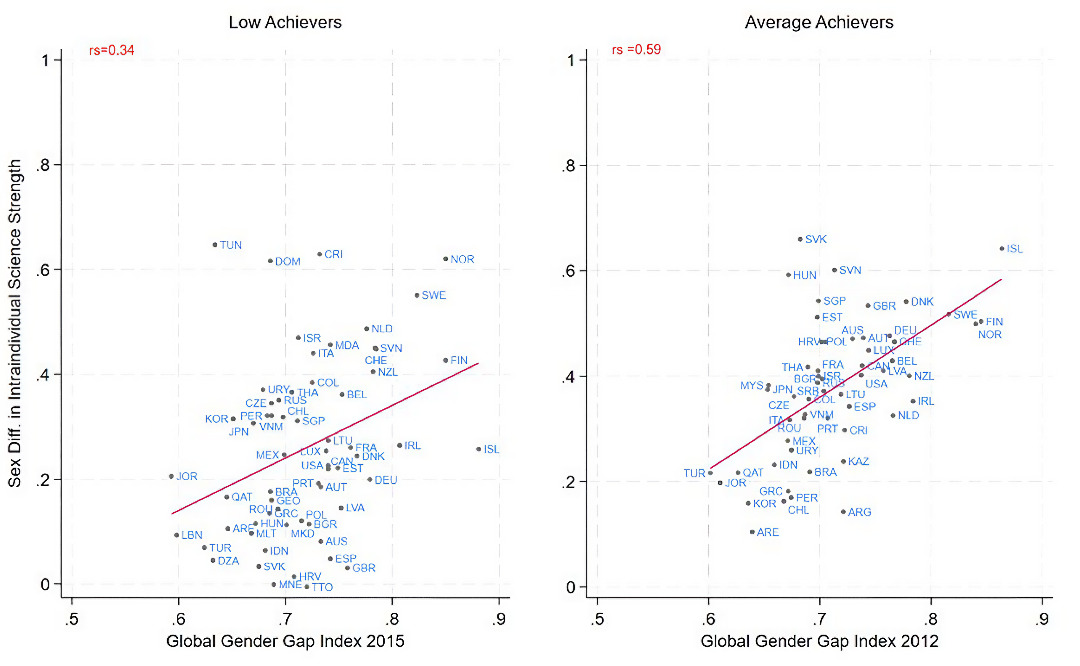
The gender equality paradox was also found for science as an intraindividual strength across PISA waves and achievement levels (Fig. 6), although the correlations were only marginally significant for high and intermediate achievers in PISA 2018. In line with previous research (Balducci et al., 2024), correlations were generally higher than those found for reading, indicating a stronger relation between the sex differences in science as an intraindividual strength and GGGI scores. These ranged from rs = 0.34 (95% C.I. = [0.11, 0.57], p < .001, n = 63) among low achievers in PISA 2015 to rs = 0.59 (95% C.I. = [0.40, 0.79], p < .001, n = 57) among intermediate achievers in PISA 2012. Once again, Iceland was an outlier, especially among high achievers, and excluding it from the PISA 2018 analysis resulted in a correlation in line with the others, but smaller (rs = 0.25, 95% CI = [0.02, 0.47], p = .03, n = 69).

OLS results supported the correlational findings, with some nuance. Compared to the correlations, coefficients were generally more stable across achievement levels for reading as an intraindividual strength. On average, across waves and achievement levels, a one SD increase in GGGI was associated with about a 0.30 SD increase in girls’ advantage in reading as an intraindividual strength (range between β = .26, p = .05, r2 = .05, n = 70, low achievers in PISA 2018 and β = .37, p < .01, r2 = 0.12, n = 57, intermediate achievers in PISA 2012). Again, coefficients were not significant in PISA 2018 among high and intermediate achievers, but this changed when we excluded either Iceland or both Iceland and Sweden from the analysis (see S13 Table).
The sex differences in science as an intraindividual strength followed the correlational pattern, but all effects were significant. On average, a one SD increase in the GGGI resulted in a 0.40 SD increase in boys’ advantage in science as an intraindividual strength across PISA achievement levels (range between β = .34, p = .02, r2 = 0.08, n = 63, low achievers in PISA 2015 and β = .57, p = .02, r2 = 0.32, n = 57, intermediate achievers in PISA 2012). Once more, this association was somewhat stronger than that observed for the sex differences in reading.
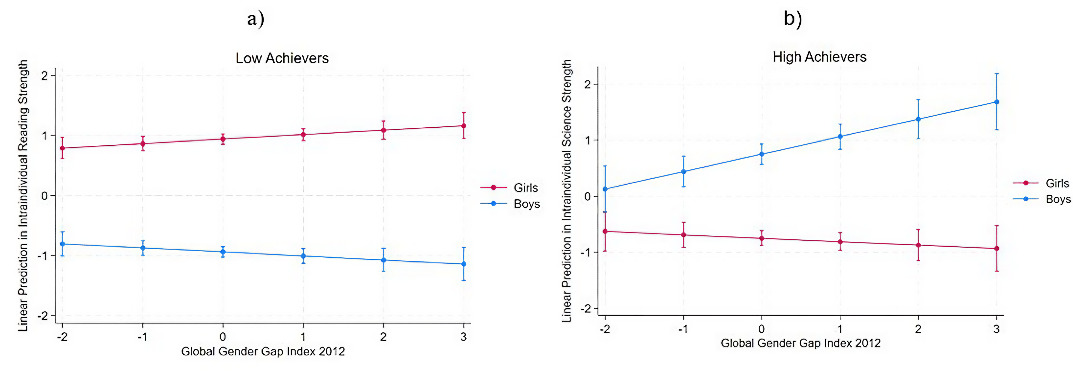
Finally, follow-up analyses that included an interaction term between sex and GGGI revealed that at the country level, the sex exhibiting an overall advantage in an intraindividual strength tended to show higher intraindividual performance when GGGI score increased, while the sex that exhibited an overall disadvantage tended to show worse intraindividual performance (see S16 Table). For example, looking at reading among low achievers in PISA 2012 (Fig. 7, panel a), girls’ intraindividual strength were higher while boys’ strength where lower with increases in gender equality (sex by GGGI, β = -.14, p =.01). Similarly, among high achievers in the same PISA wave (Fig. 7, panel b), boys performed better in science as an intraindividual strength in high GGGI countries while girls showed the opposite trend (sex by GGGI, β = .37, p < .001). The same pattern was found across waves and achievement levels, although the interaction was not significant for reading among higher achievers in any PISA wave (p > .05).

Discussion
In this preregistered study, we analyzed data from three PISA waves (2012, 2015, 2018), including 1.6 million adolescents across 82 countries and regions, to assess sex differences in intraindividual academic strengths among high (95th percentile), intermediate (between 5th and 95th percentile), and low (5th percentile) achievers. Unlike prior studies (Guiso et al., 2008; Stoet & Geary, 2013), we examined these patterns separately for high, intermediate, and low-achieving students as well as considered overall academic achievement rather than subject-specific performance. The results provide a unique perspective on (1) sex differences in intraindividual academic strengths across achievement levels, countries, and PISA waves; (2) the relations among these sex differences; and (3) their link to national levels of gender equality, as measured by the GGGI. We discuss each perspective, along with associated implications below.
Sex differences in intraindividual strengths across PISA achievement levels
We confirmed girls’ advantage in reading as an intraindividual strength and boys’ advantage in mathematics and science at each PISA achievement level. These sex differences were evident for mean intraindividual strength scores, the ratios of girls to boys, and the percentages of girls and boys whose main strength was in mathematics, reading, or science. Our results are consistent with research on sex differences in academic tilts (i.e., comparing two strengths), showing that girls more likely have a tilt favoring reading or other verbal abilities and boys a tilt favoring mathematics, science, and related (e.g., spatial) abilities (Humphreys et al., 1993; Park et al., 2007; Stoet & Geary, 2015; Wai et al., 2018). At the same time, our results extend those found with ability tilts (e.g., reading vs. mathematics) that do not control for overall achievement levels. In other words, the same sex differences emerge for our intraindividual strengths when overall achievement level is controlled. This consistency suggests that similar underlying mechanisms might be at play, and that these differences might not be solely driven by variations in general cognitive abilities.
For mathematics, the average sex differences as an intraindividual strength were similar across achievement levels, and the ratio always favored boys, ranging from 2:1 to 3:1. Boys’ advantage was also observed when analyzing the percentage of students with mathematics as their main intraindividual strength at different levels of PISA achievement. Although the findings for high achievers are similar to those reported by Stoet and Geary (Stoet & Geary, 2013) for earlier PISA waves (2000-2009), the general trend of smaller differences at intermediate and lower achievement levels was not found for our analyses. Further, based on Wai et al. (Wai et al., 2018), we might have expected sex differences to widen among high achievers.
Without exception, girls had an advantage in reading as an intraindividual strength across PISA waves, countries, and at each level of achievement. These patterns emerged for mean intraindividual sex differences, sex ratios, and percentages. We predicted that girls’ advantage for reading as an intraindividual strength would be larger at low- than intermediate - or high-achievement levels. This was the case for PISA 2012, but the pattern was not replicated in subsequent waves. The 2012 result could simply reflect random variation in effect size or may be influenced by changes in the PISA assessment in later waves. Note, however, that many of the largest sex differences across countries and waves were for girls’ intraindividual strength in reading, including a ratio of over 10 girls for every boy for high performers in PISA 2012. Overall, girls’ advantage for reading as an intraindividual strength is substantial and found throughout the achievement distribution and everywhere in the world.
Like mathematics, boys’ advantage in science as an intraindividual strength was consistent across PISA waves and achievement levels, in keeping with Wai et al.’s (2010) findings for mean science scores on various achievement measures. We again expected larger differences for high achievers, but results were inconsistent across countries and PISA waves. The gist is that the magnitude of boys’ advantage in science as an intraindividual strength is modest and about the same across achievement levels.
The discrepancy between our hypothesized and actual results is likely due, at least in part, to methodological differences in how achievement levels were defined. Previous research (Stoet & Geary, 2013) tended to focus on subject-specific achievement levels, such as mathematics or reading, and examined sex differences within each domain separately before comparing patterns. In contrast, our study emphasized overall PISA achievement levels, which provide a broader measure of general academic proficiency. Moreover, the assessments analyzed in other studies (Wai et al., 2018; Wai, Lubinski, et al., 2010) are generally more challenging for students than the PISA and frequently administered to younger, highly selected samples. Lastly, prior research focused on mean sex differences or math-verbal (or related) ability tilts (Humphreys et al., 1993; Wai et al., 2018), and these might differ from intraindividual strengths. Thus, it remains to be determined if, among other factors such as stereotypes and individual choices (Breda et al., 2020; Wang & Degol, 2013), ability tilts or our intraindividual strength approach better predicts sex differences in educational and occupational trajectories.
Correlations between sex differences in intraindividual strengths
We also examined correlations between intraindividual strengths and anticipated that countries with high reading achievement would show a larger sex difference, favoring girls, for reading as an intraindividual strength and smaller sex differences in mathematics and science. The prediction was based on changes in sex differences in mean subject-specific PISA scores across the ability distribution (Stoet & Geary, 2013), where the reading gap was larger and the mathematics gap smaller among low performers, and the mathematics gap was larger and the reading gap smaller among high performers. However, this pattern was not replicated in the present study. On the contrary, we found that countries that foster girls’ advantage in reading as an intraindividual strength also foster boys’ advantage in mathematics and science as intraindividual strengths, resulting in a positive correlation between the two.
Conversely, we also found a surprising negative correlation between sex differences in mathematics and science as intraindividual strengths, especially among high achievers, suggesting a trade-off between mathematics and science within individuals (see supplementary material). In other words, students tended to score relatively better in mathematics than in science or vice versa. It could be that adolescents who are interested in mathematics/science make curriculum choices that favor one or the other, but this hypothesis remains to be tested.
Sex differences in intraindividual strengths and gender equality
We consistently observe a gender equality paradox for sex differences in reading and science as intraindividual strengths. At the same time, boys’ advantage in mathematics as an intraindividual strength is stable across countries and achievement levels and emerges independent of national levels of gender equality (Balducci et al., 2024; Stoet & Geary, 2018). Generally, the gender equality paradox for intraindividual strengths in reading and science is not only found across PISA waves but also for low, intermediate, and high achievers, once overall levels of achievement are adjusted for. The interaction models reveal that countries with the highest levels of gender equality have the largest gaps because gains in intraindividual strengths across GGGI scores are sex-specific. Girls’ relative intraindividual advantage in reading is larger in more gender equal countries, as is boys’ intraindividual advantage in science. It could be that these sex differences are more apparent in wealthy, gender-equal countries because many sex differences are more fully expressed, for reasons that are not yet entirely understood but are likely to be both biological and cultural (Geary, 2021; Halsey & Geary, 2025). Nevertheless, the consistency of our findings implies that the social, educational, or related factors (e.g., general health, national wealth) influencing sex differences in intraindividual strengths are captured by the GGGI, despite potential issues with this measure (Else-Quest & Grabe, 2012; Stoet & Geary, 2019).
Implications
Based on expectancy-value theory, intraindividual academic strengths contribute to people’s educational and occupational choices (Dekhtyar et al., 2018; Eccles, 1983; Wang & Degol, 2013), although the extent to which these sex differences are important relative to other contributing factors, such as occupational interests (Lippa et al., 2014), is still debated (Breda et al., 2020; Wang & Degol, 2013). If anything, sex differences in intraindividual strengths should be relatively more important in wealthy countries with liberal social mores that provide an environment where sex differences can be more fully expressed (Balducci et al., 2024; Siy et al., 2023). In line with this prediction, Stoet and Geary (2022) found that adolescents’ aspirations to enter sex-typical occupations (people-oriented for girls, things-oriented for boys) were highest in gender-equal countries like Finland, Norway, and Sweden and lowest in Indonesia and Morocco. Given this, the broad pattern of sex differences in intraindividual academic strengths across achievement levels, countries, and PISA waves, as well as their increase for reading and science in more gender-equal countries, makes intraindividual strengths a plausible contributor to sex differences in some STEM fields.
Also, while boys’ relative advantage in mathematics and science may be relevant for explaining sex disparities in STEM fields, the substantial relative advantage that girls and women have in reading might be even more influential, as this could result in many of them opting out of inorganic, math-intensive STEM careers. Consider, in fact, that we found 52%, 80%, and 48% more boys than girls with mathematics or science as their main intraindividual strength across high, intermediate, and low-performing students, respectively. In contrast, at these same achievement levels, 231%, 189%, and 175% more girls than boys had reading as their main intraindividual strength. Similarly, the significant relative disadvantage that boys and men have in reading is frequently overlooked in research but may limit their potential career options. These patterns are in keeping with sex differences in observed occupational choices, especially in wealthy, gender-equal countries (Humphreys et al., 1993; Stoet & Geary, 2022).
Note that STEM fields are not only related to cognitively demanding jobs, but they also include high-skilled blue-collar occupations that involve working with technology (e.g., machinist). These occupations are overwhelmingly male-dominated, and adolescent boys aspire to enter them at much higher rates than do adolescent girls, especially in wealthy, gender-equal countries (Stoet & Geary, 2022). Our finding that sex differences in intraindividual academic strengths are found throughout the performance continuum suggests that these strengths might be important contributors, among other factors, to the underrepresentation of women in male-skewed blue-collar occupations. In other words, the implications of sex differences in intraindividual academic strengths extend beyond the high-skill white-collar STEM jobs that are the typical focus of debate in this area.
Critiques
Ilmarinen and Lönqvist (2024) recently argued that sex differences derived from directly subtracting scores cannot be meaningfully interpreted, so that the mean of men and women should be analyzed separately. However, analyzing, for instance, variation in sex differences in intraindividual strengths or variation in men’s and women’s intraindividual strengths are two distinct research questions. Ilmarinen and Lönqvist´s study has, nevertheless, the merit of showing that not all the aspects of sex differences and their relation to gender equality measures are captured by correlational and regression methods. Here, we were interested in how sex differences vary with increases in gender equality rather than exploring whether boys, girls, or both drive the paradox. Nevertheless, our interaction effects address this question and suggest that the sex with relatively favorable scores (e.g., reading as girls’ intraindividual strength) gains the most when national gender equality increases, while the opposite holds for the sex with less favorable scores.
Also, Berggren and Bergh (2025) have argued that the gender equality paradox could be a function of data quality issues or that grouping countries by similar cultures might substantially reduce its effect. The former explanation is unlikely given the established PISA methodology and the fact that we strictly follow the PISA recommendation for data analysis (OECD, 2009). The latter also poses a significant problem by considerably reducing the statistical power of the analysis, as countries with similar cultures also tend to have similar levels of gender equality.
Limitations and conclusion
Our study is correlational in nature and, thus, does not allow for causal inference. However, the gender equality paradox provides an assessment of social constructivists’ theories, which have predicted smaller sex differences in more gender equal countries (Eagly & Mitchell, 2004; Else-Quest et al., 2010). Additionally, the data did not permit a direct test of expectancy-value theory, as information on students’ intentions to enroll in a STEM degree was not available for all PISA waves, but these are described for PISA 2018 by Stoet and Geary (Stoet & Geary, 2022).
We acknowledge potential issues with the GGGI measure but argue that it is the best currently available measure of the extent to which a country has achieved gender equality in broad domains of life and the one that best aligns with feminist, social-constructivist theories (Eagly & Wood, 2012). Moreover, as noted, the results for the GGGI were consistent across PISA waves and achievement levels and also related to sex differences in many other domains (Herlitz et al., 2024), indicating that this index is capturing systematic differences across countries. These differences may or may not relate specifically to gender equality, but are likely related to cultural factors, such as social mores that allow for the full expression of individual and thus sex differences (Balducci, 2023). In other words, in cultures with more liberal mores and greater access to resources, sex differences are more fully expressed, leading to a larger magnitude than that found in other cultures (see Halsey & Geary, 2025 for a more detailed account).
The number and type of skills measured by PISA represents another limitation. While the test is comprehensive, it is restricted to mathematics, reading, and science. Since intraindividual strengths are based on deviations from a mean score, a more complete analysis could incorporate a wider range of skills, such as problem-solving or spatial abilities where men and women have also shown differences (Halpern & Wai, 2019; Miller & Halpern, 2014). Similarly, because this study’s findings may be related to the age group assessed in PISA, replicaion analyses should be carried out using other international datasets, such as PIAAC, which offers a broader age spectrum.
Despite the above caveats, our results suggest that reducing sex disparities in STEM fields may be more complex than previously thought. Among high achievers, the substantial advantage of girls in reading, along with its positive relation to sex differences in mathematics and science as intraindividual strengths, indicates that focusing solely on improving girls’ performance in mathematics and science might inadvertently lead more women away from mathematics-intensive STEM fields. Conversely, the disadvantage boys face in reading as an intraindividual strength should not be overlooked, as it has implications for the general pipeline to higher education (Geary & Stoet, 2020; Stoet & Geary, 2020a).
Acknowledgments
The lead author expresses gratitude to the Finnish Cultural Foundation for supporting this research (Grant No. 00220166).