Throughout the 20th century, IQ test scores increased by 2.5 to 3.0 IQ points per decade, a phenomenon known as the Flynn effect (Flynn, 1984, 1987; Pietschnig & Voracek, 2015; Trahan et al., 2014). In recent decades, however, IQ change trajectories have become increasingly inconsistent, as studies across numerous countries either observed a decreasing strength of these IQ gains (for a meta-analysis, see Pietschnig & Voracek, 2015), stagnations (e.g., Cotton et al., 2005), or even declines in IQ (Dutton et al., 2016). While decreases in gain strength might be explained by saturation or diminishing returns from some suspected IQ-boosting factors (e.g., nutrition, education; Flynn & Shayer, 2018; Pietschnig & Voracek, 2015), they are insufficient to explain IQ declines.
These increasingly accumulating inconsistent trajectories might be explained by increasingly fine-grained, domain-differentiated investigations of the Flynn effect (e.g., Andrzejewski et al., 2026). More specifically, previous Flynn effect studies usually have investigated change trajectories on the level of g, or fluid and crystallized intelligence, according to the intelligence taxonomy of Cattell (Cattell, 1943; for discussion, see Pietschnig & Voracek, 2015). However, our modern understanding of intelligence has led to more refined models and test instruments. For instance, one of the currently most widely accepted theories of cognitive abilities, the Cattell-Horn-Carroll (CHC) model of cognitive abilities (Schneider & McGrew, 2018), conceptualizes cognitive abilities as comprising three strata with g on the superordinate stratum III on the highest level of abstraction, 18 distinct but correlated broader abilities on stratum II, and a large number of subordinate specific abilities on stratum I. Indeed, investigating the Flynn effect on the level of CHC stratum II domains yields heterogenous, domain-specific change trajectories (Lazaridis et al., 2022), although changes appear to be further differentiated according to stratum I abilities (Oberleiter et al., 2025).
Currently, one of the most influential models for our understanding of attention is the attention network model (ANM; Petersen & Posner, 2012). The ANM comprises three different attention networks, namely an alerting network related to sustained vigilance, an orienting network related to prioritizing sensory input, and an executive network related to focal attention and conflict monitoring. Corresponding to recent findings of domain-differentiated Flynn effect trajectories, changes in attention may conceivably also be differentiated according to the three ANM networks.
Another explanation for inconsistent change trajectories could be rooted in psychometrical artifacts due to measurement non-invariance between assessments of examined cohorts. Cross-temporal IQ changes do not necessarily reflect cognitive ability changes, but may well be a consequence of changes in certain test properties, particularly differential item functioning. Indeed, it has been shown that measurement non-invariance can lead to misestimations of the strength as well as the direction of cross-temporal test-score changes (Gonthier & Grégoire, 2022). Despite the general relevance of measurement invariance, which has been well-established since decades of research (Beaujean & Osterlind, 2008; Gonthier et al., 2021; Gonthier & Grégoire, 2022; Wicherts et al., 2004), research reports on the Flynn effect in the extant literature so far have only rarely accounted for such potential artifacts.
Examining the Flynn effect of attention-related abilities is important for understanding test-score changes, due to at least two reasons: First, change trajectories may contribute to understanding the apparent domain differentiation of the Flynn effect in stratum I. Second, attention-related abilities are frequently assessed by measuring outcomes which are largely insensitive to measurement non-invariance (e.g., the number of correctly identified critical stimuli). Consequently, cross-temporal test-score changes should allow a meaningful interpretation as genuine ability changes.
Most of the research on the Flynn effect thus far has focused on psychometric test-score changes, whilst changes in selective attention and attentional control have only been comparatively rarely investigated. For example, a number of studies have observed gains in the trail making test B (Dickinson & Hiscock, 2011; Dodge et al., 2014; Overton et al., 2018) and the d2 test of selective attention (Andrzejewski et al., 2024).
Performance gains in executive functioning have also been frequently reported for tasks such as the clock drawing (Zhang et al., 2024), digit span forward (Wongupparaj et al., 2017), digit span backward (Sacuiu et al., 2010), and digit symbol tests (Dickinson & Hiscock, 2010, 2011; Munukka et al., 2021; Steiber, 2015). In contrast, stagnating scores have been reported for digit span forward and backward tasks (Gignac, 2015; Overton et al., 2018) as well as sign-inconsistent changes in the trail making and digit symbol tests (Merten et al., 2022). Finally, declining scores have been reported in the test scores of the digit symbol (Weuve et al., 2018) and digit span backward tests (Wongupparaj et al., 2017). Executive functioning changes apparently show substantial differentiation in terms of strength and direction akin to the observed differentiation of stratum I-based cognitive domains. Conceivably, in turn, this may translate to changes especially in cognitive abilities that are closely related to attention.
Importantly, it has been suggested that the development of selective attention and attentional control may be particularly susceptible to influences of modern technology in general and digitalization in particular, although there have been contrasting expectations in terms of the outcome. On the one hand, it has been argued that widespread exposure to modern, visually stimulating environments in television, video games, or the internet may represent an incidental training of cognitive abilities in general and visual-spatial abilities in particular (Clark et al., 2016; Neisser, 1997). This idea suggests that technology should exert mainly positive influences on IQ test scores (Clark et al., 2016) and that this may be particularly apparent in the elderly population (Bordone et al., 2015). However, positive effects of technology exposure are unlikely to explain the entirety of observed test score gains (Pietschnig, 2016).
On the other hand, exposure to digital technologies has been shown to be negatively associated with executive functions, thus suggesting detrimental effects of digitalization on selective attention and attentional control. Specifically, negative associations have been found in meta-analyses of media-multitasking (Jeong & Hwang, 2016; Uncapher & Wagner, 2018) and short-form video use (e.g., TikTok; Nguyen et al., 2025). Further meta-analytic evidence indicates associations of problematic internet use and ADHD (attention-deficit/hyperactivity disorder) symptoms, a condition characterized by executive dysfunction (Augner et al., 2023; Thorell et al., 2024; Wang et al., 2017).
It has been theorized that the near-permanent use of digital media leads to information overload, thereby diminishing attention spans (Yousef et al., 2025). However, research syntheses also emphasize that such findings are frequently based on cross-sectional study designs that are unsuitable to establish causality, thus rendering interpretations about reasons for the observed associations and patterns speculative (Augner et al., 2023; Lodge & Harrison, 2019; Thorell et al., 2024; van der Schuur et al., 2015; Vedechkina & Borgonovi, 2021; Wang et al., 2017; Wiradhany & Nieuwenstein, 2017). It remains therefore unclear whether attention-related abilities changed in the digital age.
Here, we investigate cross-temporal changes in a test of selective attention and two tests of attentional control in Austrian adults since the early 2000s. To this end, we investigated performance changes between 2000 and 2025 in population-representative data regarding sex and age from well-established cognitive test instruments, assessing selective attention, interference management, and sustained attention, using a norm-comparison design.
Methods
This study was preregistered at https://osf.io/kcq6f prior to collecting any data. Deviations from this preregistration are openly accessible (Willroth & Atherton, 2024), together with the anonymized data of the purposefully recruited 2025 sample, as well as the full analysis code at https://osf.io/rzgpt/files/osfstorage, whereas access to the test standardization data from the early 2000s is restricted.
Participants
We used three archival datasets and data from one purposefully recruited sample to assess cross-temporal change in three computerized tests of selective attention and attentional control in Austrian adults via a norm-comparison design (Oberleiter et al., 2024). Detailed sociodemographic characteristics of all samples are reported in Table 1.
Participants from the three independent archival samples were originally recruited for test standardizations of these three tests by an Austrian test publisher, using stratified quota sampling to obtain population-representative samples for the German-speaking countries (Austria, Germany, and Switzerland) with regards to participant sex and age. For a selective attention test (Cognitrone; Schuhfried, 2024a; CHC II domain Gt, CHC I domain mental comparison speed; ANM alerting), data were collected in 2000 (N = 221, 71.5% women, age M = 47.9 years, SD = 16.5, range = 16-83). For the Stroop test, a test of interference management (MacLeod, 1991; Schuhfried, 2023; Stroop, 1935; CHC II domain Gwm, CHC I domain attentional control; ANM executive control), data were collected from 2000 to 2003 (N = 327, 52.3% women, age M = 42.4 years, SD = 17.9, range = 18-85). Finally, for a sustained attention test (Vigil; Schuhfried, 2024b; CHC II domains Gwm/Gt, CHC I domains attentional control/simple reaction time; ANM alerting), data were collected in 2003 and 2004 (N = 267, 52.1% women, age M = 46.3, SD = 18.1, range = 17-91). We excluded archival data of three individuals with implausibly short response times indicating non-compliance (one for the Cognitrone, two for the Stroop test).
We used quota sampling to purposefully recruit participants in 2025 (N = 410, 57.8% women, age M = 45.0 years, SD = 19.0, range = 18-88). Specifically, we aimed to match participants individually to the archival data as closely as possible with regards to their self-reported sex, age, and highest educational attainment (henceforth referred to as “education”) prior to any change assessment.
To obtain comparable sociodemographic distributions between the archival and novel samples for each test instrument, it was therefore necessary that the novel sample was larger than the corresponding archival samples. Both the target sample size and demographic break-up were defined prior to collecting any data and obtained by matching simulated novel samples with different sociodemographic composition to all three archival samples, until significant differences in key sociodemographic characteristics (sex, age, education) were deemed highly unlikely for each test instrument.
Materials
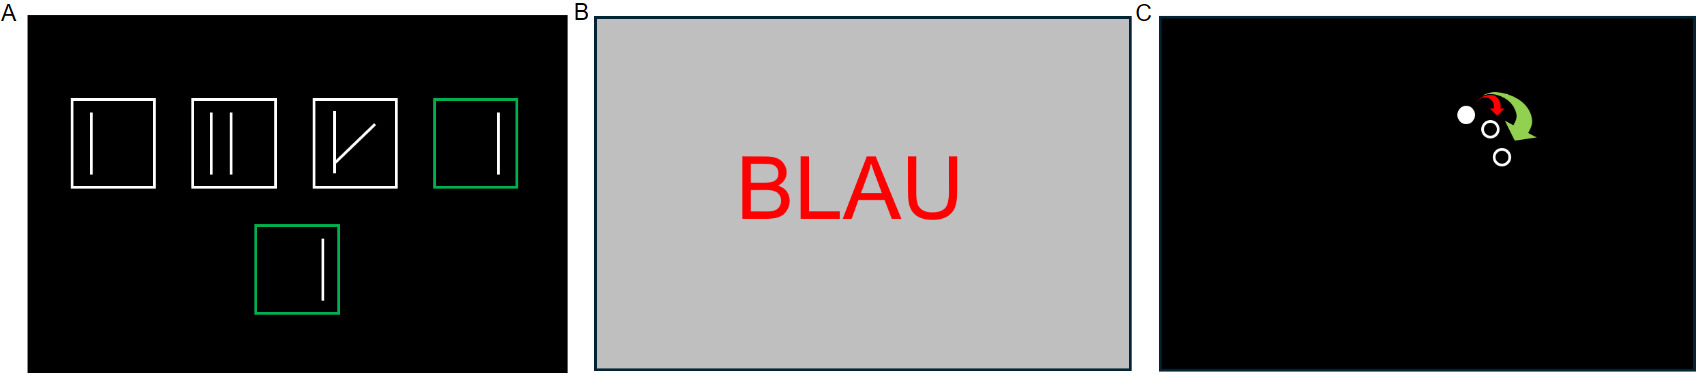
All data were collected using computerized, standardized tests, using a dedicated test administration software (https://vts.schuhfried.com/dashboard/home). First, participants were administered the selective attention test (Cognitrone), followed by the interference management test (Stroop test), and the sustained attention test (Vigil). Example items are provided in Figure 1. Of note, the archival data were collected using custom test keyboards, while the novel data were collected using standard computer keyboards (Microsoft Wired Keyboard 400, Microsoft Corporation, Redmond, WA, USA; Logitech Deluxe 250 Keyboard, Logitech International S.A., Lausanne, Switzerland). According to validation assessments, as opposed to the custom keyboards, standard computer keyboards may consistently introduce minor delays (i.e., increases) in response time (ranging from 5 to 50 ms), but never result in decreases in response time (Schuhfried, 2023, 2024a, 2024b).
__interference_test_(panel_.png)
The Cognitrone (version S2; Schuhfried, 2024a) is a selective attention test. Participants are presented a panel of four abstract reference figures and one test figure (for an example, see Figure 1A). Participants must indicate as quickly as possible whether or not the test figure is identical to one of the reference figures (200 total trials, 79 of which comprise identical and 121 non-identical figures). Reference figures are replaced by a new one after every tenth trial, whereas test figures are replaced immediately after each response. Test duration is 15 minutes according to the manual. The primary outcome is selective attention, measured as the mean response time for correct rejections of non-identical figures. Furthermore, processing speed (mean response time for correct hits) and two indicators of accuracy (numbers of correct rejections and hits) are assessed. Internal consistency for selective attention has been reported to be excellent (Cronbach α = .97; Schuhfried, 2024a).
The German version of the Stroop test (version S8; Schuhfried, 2023; Stroop, 1935) is an interference management test comprising two subtests. Across both subtests, German color words (e.g., blue) are displayed in a congruent or an incongruent color (for an example, see Figure 1B), with incongruent conditions inducing cognitive interference. In the first subtest, participants must indicate as fast as possible the spelled word (i.e., 128 reading trials) and in the second subtest the letters’ colors (i.e., 128 naming trials). Test duration is 10 minutes according to the manual. The primary outcome is interference management, measured as the difference between median response times to congruent and incongruent trials per subtest. In addition, four indicators of performance accuracy are assessed (i.e., the number of errors per subtest and per congruence condition). Internal consistencies for interference scores are excellent, with Cronbach α = .96 and .97 for reading and naming subtests according to the test manual, respectively (Schuhfried, 2023).
The Vigil (version S2; Schuhfried, 2024b) is a sustained attention test. Participants are presented with a white dot on a black background moving in discrete fixed distance steps (“jumps”) every two seconds in a circular trajectory for a total of 33 minutes. At pseudorandom intervals, the dot performs a double jump, covering twice the usual distance (for an example, see Figure 1C), to which participants must respond as fast as possible. Participants are unaware of the structure of the test, which is subdivided into eight blocks, each containing 4 pseudorandomly occurring double jumps, thus yielding 32 double jumps in total. Test duration is 36 minutes according to the manual. The primary outcome is sustained attention, measured as the mean reaction time to correctly identified double jumps. In addition, two indicators of accuracy are assessed (i.e., numbers of correct hits and false alarms). Internal consistency for sustained attention is high, with Cronbach α = .86 according to the manual (Schuhfried, 2024b).
Procedure
Archival Data
When the archival data were collected, participants were invited to the test center of a test publisher to complete the computerized test instruments for standardization purposes between 2000 and 2004 (Cognitrone: 2000, Stroop: 2000-2003, Vigil: 2003-2004). Participants were recruited using stratified quota sampling to obtain samples that were population-representative for Germanophone countries (i.e., Austria, Germany, and Switzerland) in sex and age, while also aiming to represent different levels of education. Tests were administered in group settings with an average of five participants per session who were administered multiple tests over a duration of about an hour. Participants were monetarily remunerated and received feedback on their test performance. For each test (i.e., Cognitrone, Stroop test, Vigil), archival data were collected independently, yielding a total of three independent archival datasets that were used in the present investigation.
Purposefully Collected Novel Data
For collecting the novel data, we recruited participants purposefully for the present study from October to December 2025 via flyers, online chat groups, word of mouth, and personal contacts. Participation was incentivized by receiving individual feedback about test performance in reference to standardization data. Participants had to be at least 18 years old and report normal or corrected-to-normal vision.
All test sessions were conducted in person in the computer assessment lab of the Individual Differences and Psychological Assessment Unit at the School of Psychology at the University of Vienna. All test sessions were conducted by the same test administrator (JL). The total duration of a test session was approximately one hour. On arrival, the test administrator briefly explained all three tests. After obtaining written informed consent, the test session commenced. All tests were preceded by standardized instructions and training trials according to the specification in the test manuals, the successful completion of which was automatically followed by the test trials. If a participant failed the training trials, the test administrator was alerted and restarted the training trials after verbal clarification. Further clarification was provided if necessary. In each session, between one and four participants were tested concurrently. Testing took place between 9:00 am and 7:30 pm.
Analysis
All analyses were performed in the R statistical computing environment (v.4.4.2; R Core Team, 2024), using RStudio v.2025.09.2 (Posit Team, 2025). First, we matched the test-takers from the novel and the archival datasets, based on participant sex, age, and education, for each test individually. For matching, we used the matchit function in R (method = “optimal”, with exact matching for sex; Ho et al., 2011), which, for each test, yielded baseline and comparison cohorts of equal size and similar sociodemographic distributions. More specifically, we had intentionally recruited a sample that was larger than each one of the independent archival samples. Then, the matching procedure allowed us to obtain three subsamples of the novel sample that were matched to the three archival samples according to sex, age, and education. Formal comparisons indicated that the three matched pairs of archival and novel samples did not differ significantly with respect to the key sociodemographic variables (Table 1).
Independent samples t-tests between archival and matched novel data were calculated for all variables. For the selective attention test, we assessed changes in selective attention scores (i.e., mean response time to correct rejections), a processing speed indicator (i.e., mean response time to correct hits), and accuracy indicators (i.e., the numbers of correct rejections and correct hits). For the interference management test, we assessed changes in reading-trials and naming-trials interference scores and in additional accuracy indicators (i.e., the numbers of errors for congruent vs. incongruent reading and naming trials). For the sustained attention test, we assessed changes in sustained attention (i.e., the reaction time for correctly identified double jumps), measures of accuracy (i.e., the number of correct hits and false alarms), and measures of the degree of within-test performance change over time (i.e., the performance slopes of these three variables). These within-test performance slopes were calculated by simple linear regressions, predicting performance by test block (eight blocks of 4 minutes 10 seconds) as a proxy for test duration per participant and variable. Thereby, we obtained intraindividual cross-temporal performance slopes for reaction times, the number of correct hits, and the number of false alarms. These slopes served as measures of change in performance over test time within a single administration (namely, how reaction times etc. evolved over the 33 minutes of test duration).
Finally, we assessed whether effects of age differed between archival and novel data. For these exploratory analyses, we used linear regressions to predict test scores by cohort (archival vs. novel), participant age, and their interaction.
We interpret effect sizes according to established benchmarks yielding bottom thresholds of very small effects (d = 0.10), small effects (d = 0.20), medium effects (d = 0.42), and large effects (d = 0.63; Cohen d thresholds are equivalent to Pearson r thresholds of Funder & Ozer, 2019). Additionally, we provide decadal IQ changes (Δ in the IQ metric). To this end, Cohen d values are divided by the year range, multiplied by 10 to obtain the estimated change per decade, and then multiplied by 15 (the standard deviation of IQ scales) to obtain changes in the IQ metric (ΔDIQ = [d / year range] x 10 x 15; for ΔDIQ, we reverse-scored variables such as reaction times so that positive vs. negative signs of ΔDIQ reflect gains vs. declines, respectively).
Results
Selective Attention
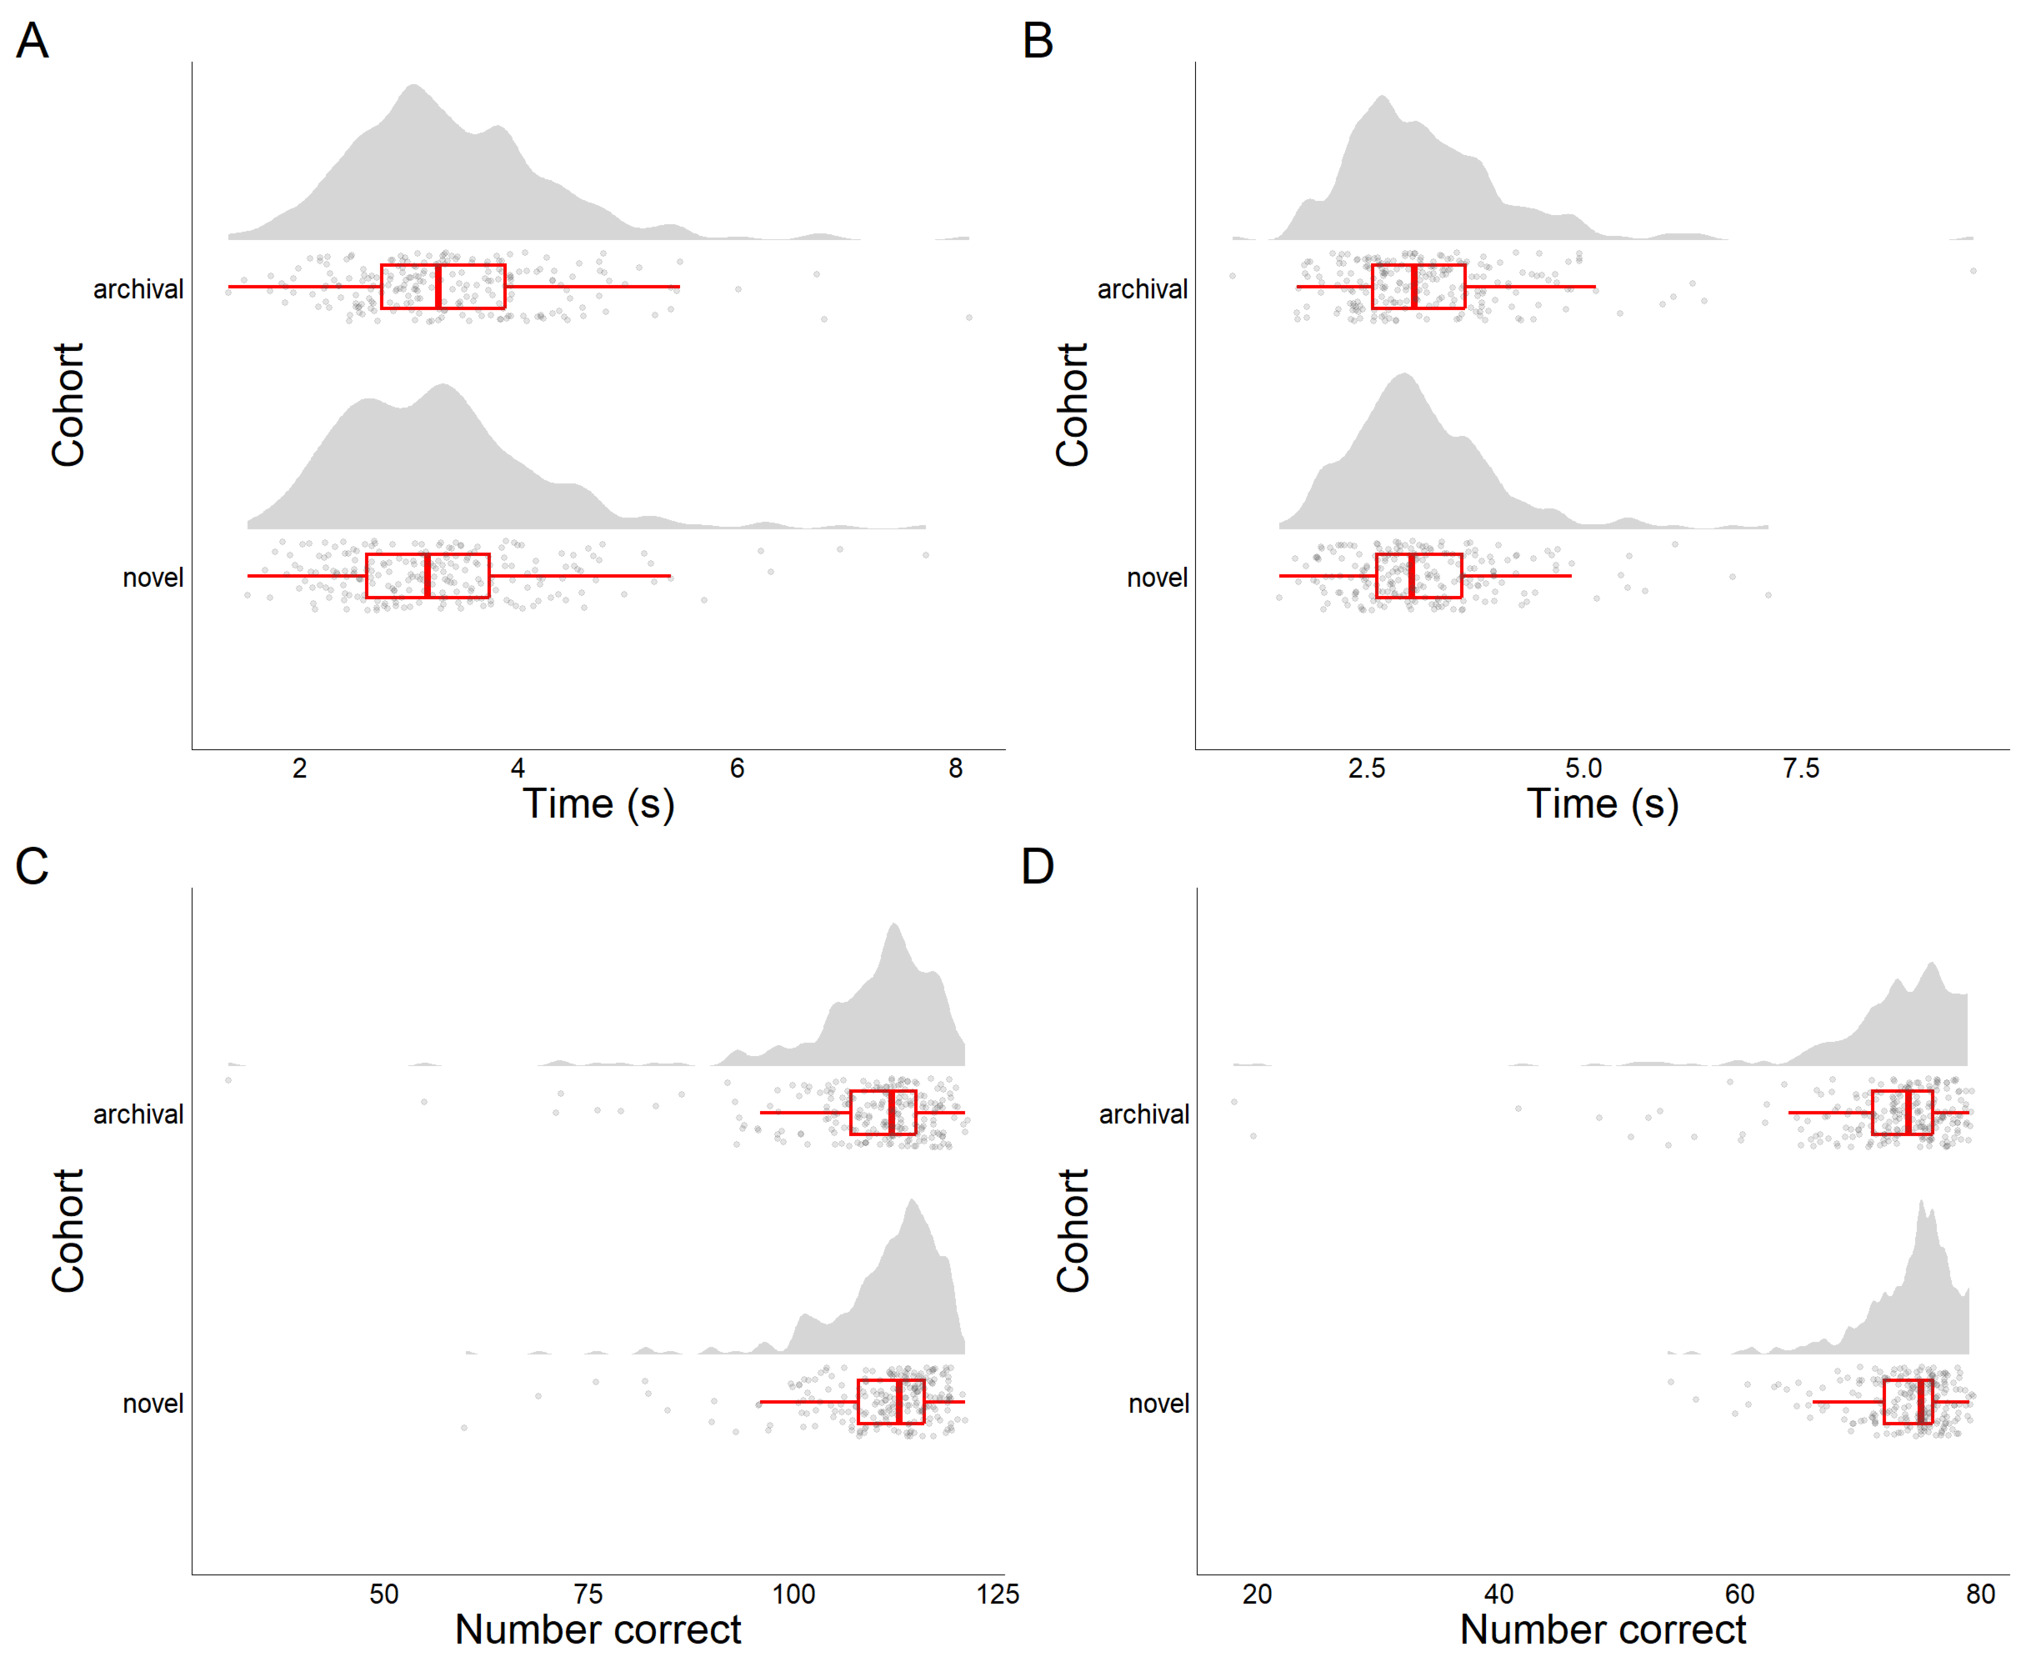
In the selective attention test, we observed very small albeit nominally non-significant increases in selective attention from 2000 to 2025 as evidenced by shorter response times for correct rejections (p = .213, d = -0.12, ΔDIQ = 0.71, Figure 2A). Processing speed did not yield meaningful cross-temporal changes (response times for correct hits; p = .680, d = -0.04, ΔDIQ = 0.24, Figure 2B). However, there were very small increases in the number of correct rejections (p = .078, d = 0.17, ΔDIQ = 1.01, Figure 2C), as well as small increases in the number of correct hits (p = .004, d = 0.27, ΔDIQ = 1.64, Figure 2D), thus indicating small gains in accuracy (cf. top third of Table 2 for numerical details).
.png)
Attentional Control: Interference Management
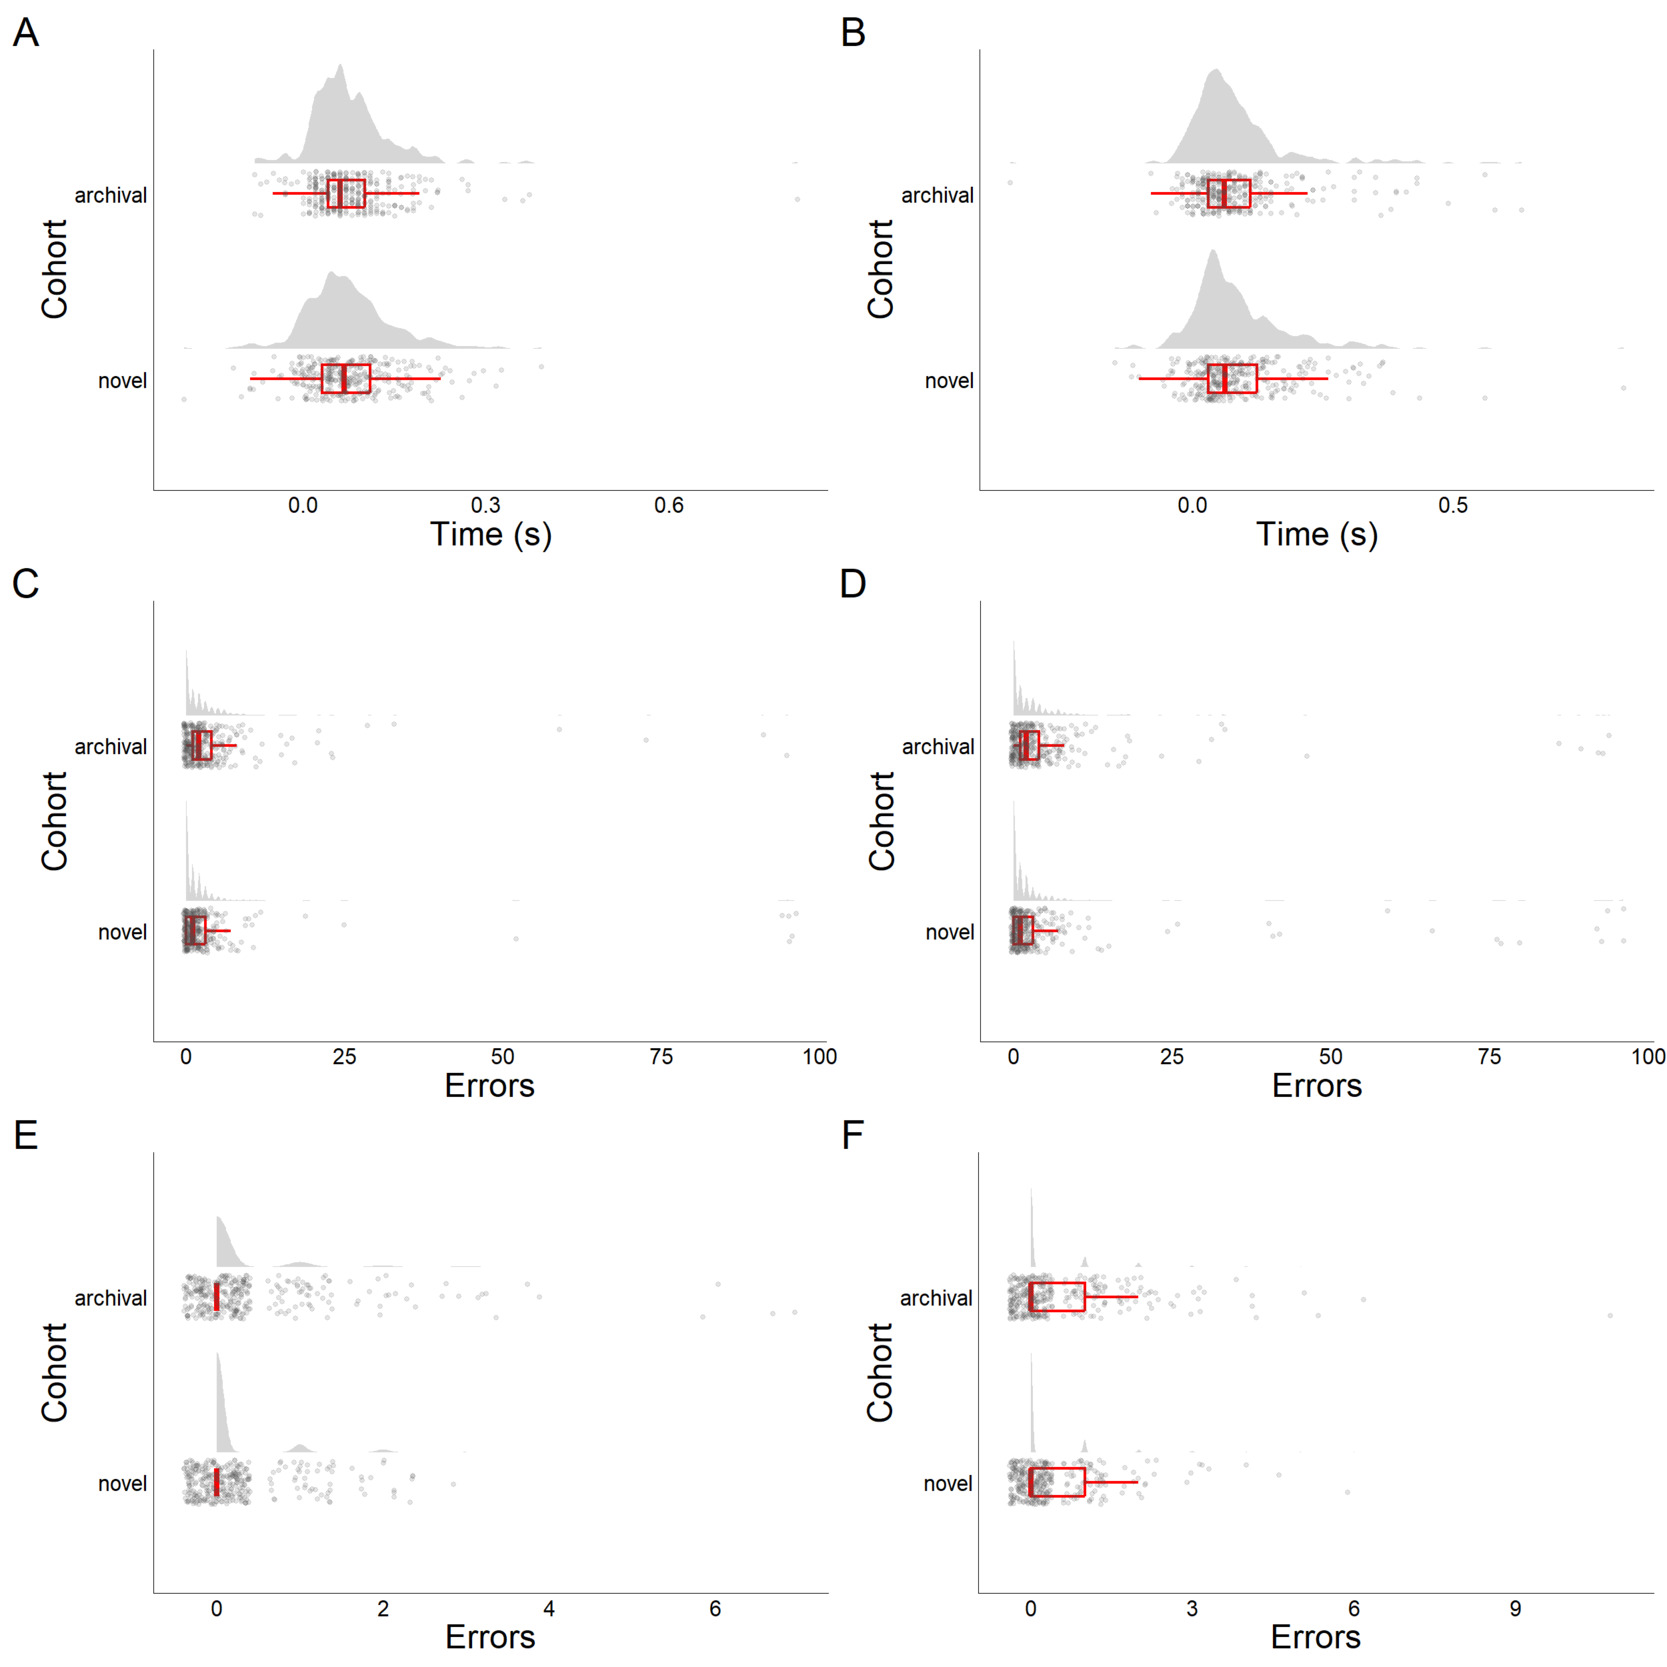
In the interference management test, we observed no meaningful cross-temporal changes in interference scores from 2000/2003 to 2025 for both the reading (p = .556, d = -0.05, ΔDIQ = 0.32, Figure 3A) and naming conditions (p = .721, d = 0.03, ΔDIQ = -0.19, Figure 3B). Similarly, there were no cross-temporal changes in the number of errors in incongruent trials in both the reading (p = .568, d = -0.04, ΔDIQ = 0.31, Figure 3C) and naming conditions (p = .860, d = 0.01, ΔDIQ = -0.09, Figure 3D). However, we observed small improvements in congruent trials in terms of the number of errors in both the reading (p = .005, d = -0.22, ΔDIQ = 1.50, Figure 3E) and naming conditions (p = .010, d = -0.20, ΔDIQ = 1.39, Figure 3F). Results are detailed in the center of Table 2.
.png)
Attentional Control: Sustained Attention
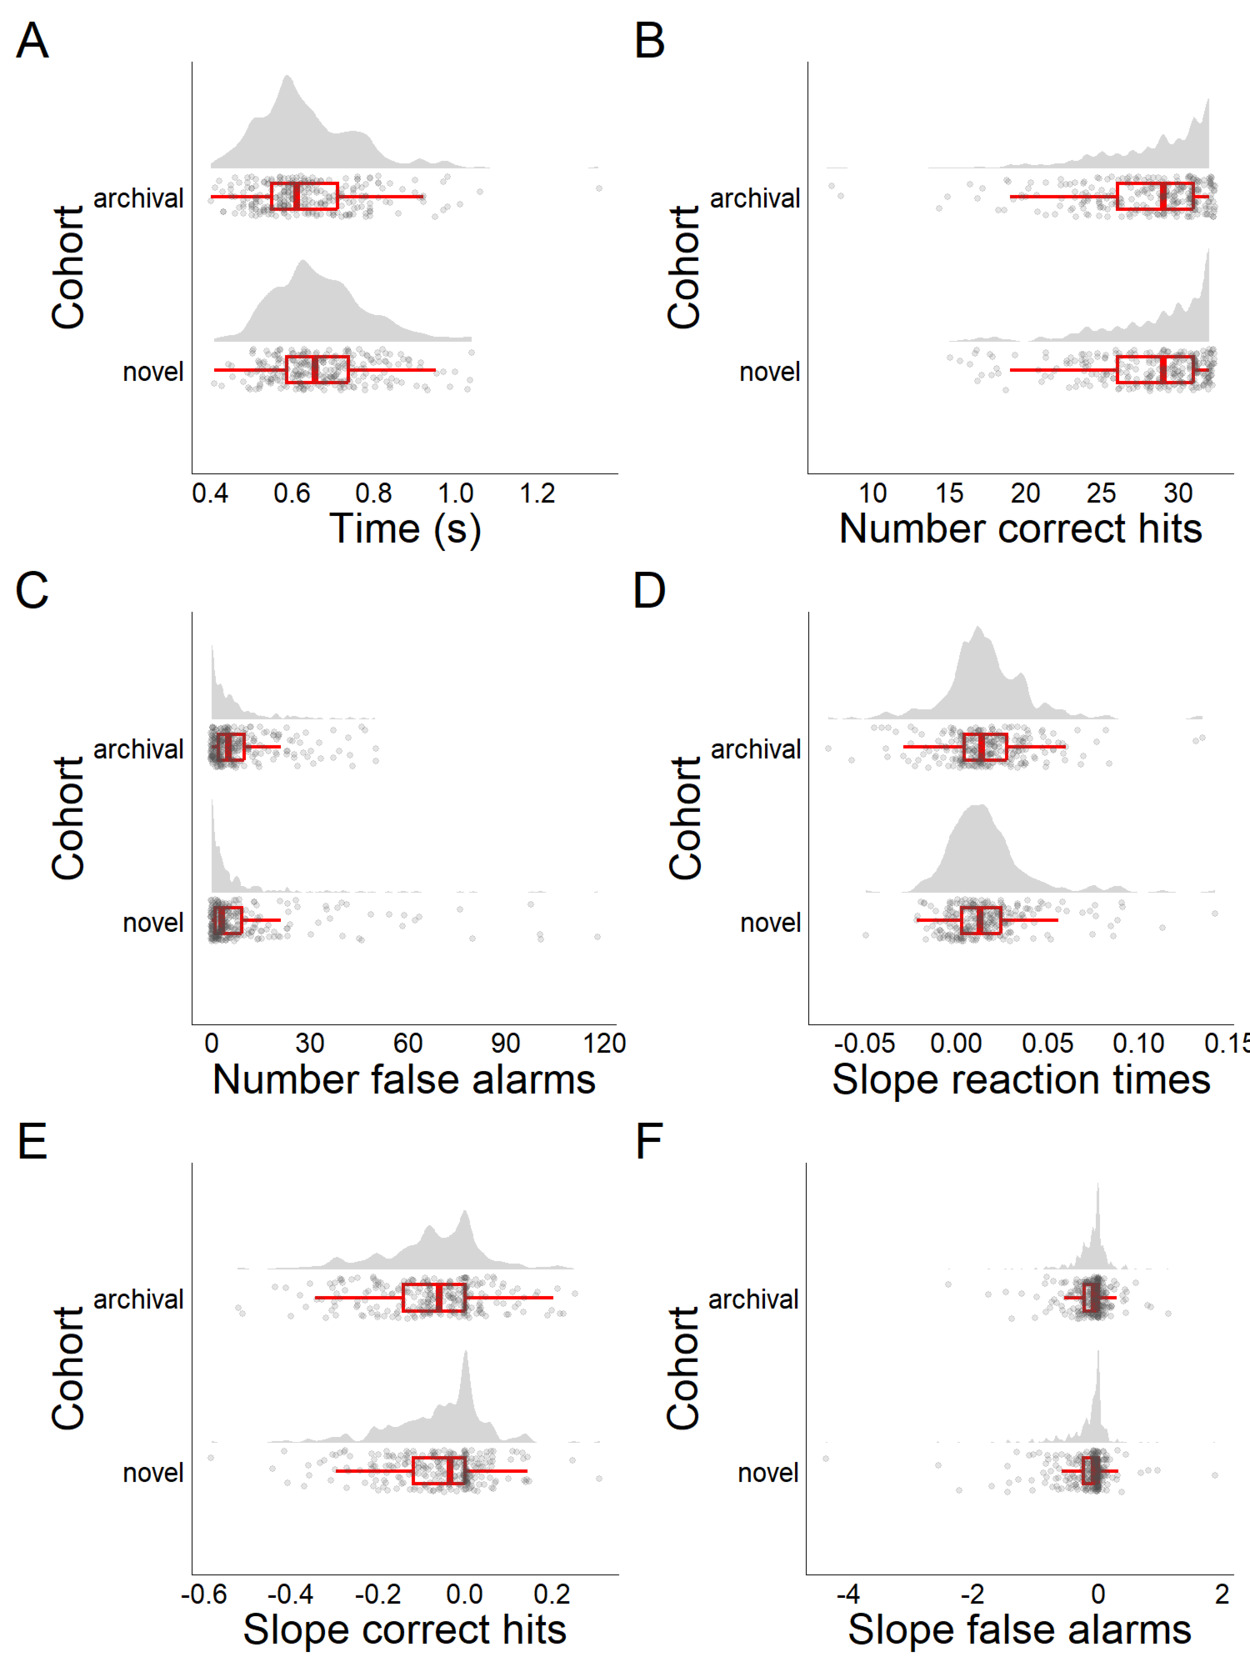
In the sustained attention test, we observed small significant decreases in sustained attention performance from 2003/2004 to 2025 (increased reaction times; p = .002, d = 0.27, ΔDIQ = -1.81, Figure 4A). For performance accuracy, no meaningful cross-temporal changes in the number of correct hits were observed (p = .372, d = 0.08, ΔDIQ = 0.53, Figure 4B), although there was a very small albeit non-significant increase in the number of false alarms (p = .215, d = 0.11, ΔDIQ = -0.73, Figure 4C). Participants’ within-test performance changes did not show any meaningful cross-temporal reaction time changes (p = .941, d = -0.01, ΔDIQ = 0.04, Figure 4D). However, we observed very small albeit non-significant improvements in the number of correct hits (i.e., slower within-test declines of correct hits; p = .169, d = 0.12, ΔDIQ = 0.81, Figure 4E) but performance decreases in the number of false alarms (i.e., faster within-test increases of false alarms; p = .065, d = 0.16, ΔDIQ = -1.09, Figure 4F). Numerical results are detailed at the bottom third of Table 2.
.png)
Exploratory Analyses: Effects of Age and Cohorts
In our exploratory linear regressions, we predicted test scores by cohort and age. Of note, we focused on potential interactions between cohort and age rather than main effects. In four out of sixteen analyses, the interaction of cohort and age reached nominal significance (p < .05). Specifically, increased age was associated with worse selective attention in the novel compared to the archival data (longer response times for correct rejections, b = 0.016), with better interference management, but more errors on incongruent trials in the naming condition (lower interference scores, b = -0.001, more errors, b = 0.162), and with more false alarms in the sustained attention test (b = 0.187). For all other variables, the interaction of cohort and age did not reach nominal significance (see Supplementary Materials at https://osf.io/rzgpt/files/osfstorage for details).
Discussion
We investigated cross-temporal changes in selective attention and attentional control (operationalized by tests of interference management and sustained attention) in adults in Austria by comparing archival test performance data, collected between 2000 and 2004, with purposefully collected and sociodemographically matched novel data, collected in late 2025. Although effect sizes in general were small, we observed directionally domain-differentiated change trajectories. For example, the main test variables selective attention, interference management, and sustained attention yielded gains, stagnation, and declines, respectively. Moreover, we observed small gains in test accuracy in two of the three tests.
The presently observed small improvements in selective attention and test accuracy but stagnation in processing speed partially support findings from a recent cross-temporal meta-analysis (1990 to 2021) of the d2 test of selective attention (Andrzejewski et al., 2024). While this quantitative research synthesis reported a stagnation in test effectiveness, processing speed, and number of errors among adults, it also reported small gains in a measure of performance accuracy (Andrzejewski et al., 2024). Our results are also in line with gains in other tests of selective attention and processing speed such as the TMT A (Dickinson & Hiscock, 2011; Dodge et al., 2014; Overton et al., 2018) or the digit symbol test (Dickinson & Hiscock, 2011; Munukka et al., 2021; Steiber, 2015) but contrast findings from other populations and countries (cf. Merten et al., 2022, and Weuve et al., 2018, who reported stagnation and declines in these tests in the US).
In terms of changes in the IQ metric, these observed gains (maximum ΔDIQ = 1.64) were smaller than the traditionally reported Flynn effect gains of about 2.5 to 3.0 IQ points per decade (Pietschnig & Voracek, 2015; Trahan et al., 2014). This finding is consistent with a potential deceleration of gains (Pietschnig & Voracek, 2015) but may be better explained by the increasingly observed domain differentiation of the Flynn effect (Lazaridis et al., 2022; Oberleiter et al., 2025), which emerged here as well.
Furthermore, observed stagnation in interference management (attentional/executive control) parallels observed stagnation in digit span tests (Gignac, 2015; Overton et al., 2018), suggesting that some narrow cognitive abilities are seemingly impervious to cross-temporal performance changes. These findings contrast reported gains in other common measures of executive functioning such as the clock drawing (Zhang et al., 2024) test or the TMT B (Dickinson & Hiscock, 2011; Dodge et al., 2014; Overton et al., 2018). Importantly, these latter tests likely are more closely connected to working memory than the Stroop test, thus once again evidencing that changes appear to be domain-differentiated. Finally, change trajectories of selective attention and sustained attention showed contrasting signs in our data despite both of them tapping the alerting network of the ANM. This may be possibly related to task-specific characteristics but warrants replication in future work. Taken together, our findings support the recently emerging view of the Flynn effect as highly domain-differentiated on the level of CHC stratum II (Lazaridis et al., 2022) and even stratum I abilities (Andrzejewski et al., 2026; Oberleiter et al., 2025).
Importantly, our results are inconsistent with the idea of sweeping declines in selective attention or attentional control in the digital age, as suggested by negative associations with digital media use. Specifically, sustained attention has been negatively linked to media-multitasking (Jeong & Hwang, 2016; Uncapher & Wagner, 2018; van der Schuur et al., 2015), problematic internet use (Augner et al., 2023; J. A. Firth et al., 2020; Wang et al., 2017), and consumption of short-form videos (e.g., TikTok; Nguyen et al., 2025). Because the widespread adoption of digital technologies such as the internet (Leiner et al., 2009), smartphones (Reid, 2018), and social media (Brügger, 2015) can be traced back to the early to mid-2000s, detrimental long-term effects of digitalization on cognitive abilities should have become apparent in the general adult population by now. Therefore, the current results challenge the widespread idea that digitalization has affected attention-related abilities of the general population negatively in an alarming manner so far (J. Firth et al., 2019; Yousef et al., 2025).
Several causes are conceivable which may explain the limited empirical support of large and cross-domain declines in selective attention and attentional control in the digital age. For example, the associations between digital media use and attention-related abilities may be differentiated based on context or media content (Lodge & Harrison, 2019; Vedechkina & Borgonovi, 2021). Furthermore, these associations could be largely correlational, not causal, in nature, as has been repeatedly emphasized in meta-analyses (Augner et al., 2023; van der Schuur et al., 2015). It is even possible that the effect direction may be reversed, meaning that individuals with lower attentional control may be more likely to display problematic digital media use patterns (Augner et al., 2023). Another possibility is that effects of digitalization on selective attention and attentional control may not affect abilities, but motivation in everyday settings. If this were the case, we may not have observed large changes because motivation in targeted cognitive assessments may have remained unaffected. Finally, potential detrimental effects of digital media use on selective attention or attentional control could largely be transitive in nature and may not last beyond childhood, adolescence, let alone young adulthood.
Notwithstanding these possibilities, it is also conceivable that beneficial and detrimental effects may work in a compensatory manner: Perhaps some cognitively beneficial effects of modern, technology-permeated environments (Clark et al., 2016; Neisser, 1997) are increasingly dwarfed by negative effects of abundant media-multitasking (Jeong & Hwang, 2016; Uncapher & Wagner, 2018; van der Schuur et al., 2015), internet use (J. A. Firth et al., 2020), or short-form video use (Nguyen et al., 2025). To shed more light on this possibility, future researchers may wish to examine selective attention and attentional control trajectories. Examining change trajectories of birth cohorts that are becoming increasingly more digitally immersed may substantiate expectations of a decline in sustained attention. This idea is consistent with the presently observed small declines in our sustained attention test.
However, this is rooted in the idea that cross-temporal changes in our data could have been dependent on age. For example, an overall stagnation could plausibly obscure gains in younger but declines in older participants and vice versa. Importantly, in exploratory analyses, we observed no evidence for such differential age effects between archival and novel data for a majority of variables. Furthermore, effects were not unequivocal in those instances where significant effects were observed, thus contrasting the idea of general age-differentiated changes.
Finally, it is important to acknowledge that we did not directly assess any digital media-related variables and therefore could not formally test any potential effects of digitalization. However, our data show that there are no substantial, negative population-level changes in attention-related abilities. Importantly, our results clearly indicate that there is no evidence for a drastic decline in attention in the digital age. Nonetheless, targeted and longitudinal investigations are warranted to determine potentially lasting effects of digital media use on cognition.
Limitations
Some limitations need to be acknowledged when interpreting the present results. Different types of keyboards were used in the archival and the novel data collections. Specifically, custom test keyboards were used to collect archival, whereas standard PC keyboards were used for collecting the novel data, thus possibly affecting the performance-change calculations (Holden et al., 2019; Silverman, 2010). According to validation studies of the presently used tests, standard PC keyboards introduce directionally consistent response latencies, as compared to custom test keyboards (i.e., response times increase slightly, but do not decrease; Schuhfried, 2023, 2024a, 2024b). This means that the presently observed change trajectories represent a lower performance threshold for the 2025 sample in terms of the response-time variables. Specifically, while gains in response-time variables (selective attention) can indeed be interpreted as genuine gains, stagnation (interference management) should only be interpreted as (at least) evidence against declines, whereas declines (sustained attention) might not be interpreted with complete certainty. In this vein, among the three tests investigated here, the sustained attention test most closely resembles a reaction-time test with correspondingly low average response times. This suggests that hardware-based response latencies might have a comparatively large impact on the performance in this specific test; if so, this would provide an alternative explanation for the small observed performance declines in the sustained attention test. Consequently, it cannot be ruled out that declining effects represent a hardware latency-related artifact, masking an underlying stagnation or even increase. Therefore, the findings of a small decline in sustained attention must be interpreted with caution. Importantly, we note that the interference scores obtained in the interference management test can be assumed to be relatively independent of hardware differences because these scores are difference scores.
Furthermore, we cannot entirely rule out that differences in test order or incentivization (monetary remuneration vs. feedback of test results) between the archival and novel sample data collections may have influenced performance differentially, particularly in terms of our sustained attention test. However, the number of correct responses (d = .08) and the slope for reaction times (d = -.01) were virtually identical between archival and novel data, thus suggesting that the observed reaction time decline was not due to order effects.
Finally, we note that only decreases in sustained attention performance would have survived Bonferroni-corrections for multiple testing of our pairwise t-tests. However, preregistration of our hypotheses and interpretation of effect sizes largely alleviates concerns about spurious findings in our analyses.
Conclusion
In all, we provide evidence for small and directionally domain-differentiated but largely age-independent cross-temporal (early 2000s vs. 2025) performance changes in Austrian adults across three distinct tests of selective attention and attentional control. We observed very small improvements in selective attention but no changes in interference management and small declines in sustained attention, though the latter finding must be interpreted with caution due to response hardware differences. Importantly, accuracy measures indicated small improvements across different measures. Our findings are consistent with emerging evidence for change trajectory differentiation and domain specificity of the Flynn effect according to stratum I of cognitive abilities in terms of the CHC model of intelligence. These findings challenge the idea of quickly emerging drastic and lasting negative effects of digitalization on selective attention and attentional control.
Author Note
Author Contributions
Jonas Lesigang: Conceptualization, Methodology, Software, Formal Analysis, Investigation, Data Curation, Writing – Original Draft, Writing – Review & Editing, Visualization. Marco Vetter: Data Curation, Writing – Review & Editing. Martin Voracek: Writing – Review & Editing, Supervision. Jakob Pietschnig: Conceptualization, Methodology, Writing – Review & Editing, Supervision, Project Administration, Funding Acquisition.
Funding
JL was supported by an FWF grant (PAT5292623) acquired by JP.
Data Availability
The preregistration (https://osf.io/kcq6f), deviations from the preregistration, novel data, and analysis code (https://osf.io/rzgpt/files/osfstorage) are publicly available online. Access to the original standardization data is restricted.
Conflict of Interest
MVe is employed by Schuhfried GmbH, the provider of the standardization data and testing software.
Acknowledgements
We are grateful to Alexandros Lazaridis and Schuhfried GmbH for their support and providing the archival (early 2000s) datasets.