Tilt refers to an ability pattern and is based on within-subject differences in two distinct abilities, yielding relative strength in one ability (e.g., verbal) and relative weakness in the other (e.g., math) (for reviews, see Coyle, 2018a; Coyle & Greiff, 2021; Lubinski, 2009, 2016). Tilt is typically unrelated or weakly related to IQ and general intelligence (g). g refers to variance common to mental tests and typically explains the predictive power of cognitive tests (e.g., Coyle, 2018a; Jensen, 1998, pp. 270–305). Despite its negligible relation to g, tilt predicts outcomes at work and school, particularly in specific areas such as the humanities and science, technology, engineering, and math (STEM) (for reviews, see Coyle & Greiff, 2021; Lubinski, 2016).
Early tilt research focused on ability tilt, based on differences in math and verbal scores on standardized college aptitude tests such as the SAT (formerly, Scholastic Aptitude Test), ACT (formerly, American College Testing), and PSAT (formerly, Preliminary Scholastic Aptitude Test) (for reviews, see Coyle & Greiff, 2021; Lubinski, 2009, 2016; see also, Coyle, 2016, 2019; Coyle et al., 2014, 2015; Lubinski et al., 2001; Park et al., 2007). The SAT, ACT, and PSAT correlate strongly with IQ and g (e.g., rs > .73 , Coyle, 2015, p. 19). Differences in math and verbal scores on these tests yield math tilt (math > verbal), indicating math strength, and verbal tilt (verbal > math), indicating verbal strength. Math and verbal tilt differentially predict criteria at school and work (e.g., jobs, college degrees, school performance), with math tilt predicting STEM criteria and verbal tilt predicting humanities criteria (Coyle et al., 2014, 2015). In addition, math and verbal tilt on the SAT, ACT, and PSAT show robust sex differences, with males showing math tilt and females showing verbal tilt (Coyle et al., 2015). The sex differences can be attributed to differential investment in STEM and humanities domains, with males investing more in math-loaded STEM domains (leading to math tilt) and females investing more in verbally loaded humanities domains (leading to verbal tilt) (Su et al., 2009; see also, Coyle & Greiff, 2021, 2023; Lippa, 1998; Stewart-Williams & Halsey, 2021; von Stumm & Ackerman, 2013).
Other tilt research has examined technical tilt and spatial/mechanical tilt, indicating relative strength in technical and spatial/mechanical abilities compared to academic abilities (for reviews, see Coyle, 2018b; Coyle & Greiff, 2021; see also, Coyle, 2019, pp. 2020, 2021, 2022a, 2022b, 2023, 2025a). This research contrasts scores on technical (e.g., automotive, shop tools, electrical) and spatial/mechanical (e.g., visualization and mechanical reasoning) tests with academic tests (verbal and math) using diverse aptitude batteries such as the Armed Services Vocational Aptitude Battery (ASVAB). The ASVAB is a personnel selection test used by the United States military and correlates strongly with IQ and g (Hering & McClain, 2003, pp. 1–14). Differences in technical and spatial/mechanical scores contrasted with academic scores yield tech tilt (tech > academic), spatial/mechanical tilt (spatial/mechanical > academic), and academic tilt (academic > tech/spatial/mechanical), with tech tilt and spatial/mechanical tilt predicting STEM outcomes and academic tilt predicting humanities outcomes (e.g., college degrees, school performance).
Recent tilt research has examined the development of tilt in adolescence (Coyle, 2022a, 2023, 2025a; see also, Coyle & Greiff, 2021, 2023). This research shows that technical and spatial/mechanical tilts increase from ages 13- to 17-years and that the increases are mediated by processing speed and g. The tilt increases are consistent with investment theories (Cattell, 1987, pp. 138–146; see also, Coyle & Greiff, 2021, 2023; von Stumm & Ackerman, 2013). Such theories assume that tilt is attributable to vocational preferences and differential investment in specific domains (e.g., technical/spatial vs. academic), boosting complementary abilities and leading to distinct tilt patterns (e.g., spatial, technical, or academic). The mediating effects of speed and g on tilt are consistent with cascade theories (Fry & Hale, 1996; see also, Coyle et al., 2011; Coyle, 2022a, 2023, 2025a; Tourva & Spanoudis, 2020). Cascade theories assume that age-related increases in speed boost g, which in turn facilitates the acquisition of specific abilities that produce tilt. Such a pattern has been observed for males and females, suggesting that the mediating impact of speed and g (on tilt) is invariant for males and females.
Whereas prior research has examined the development of tech tilt and spatial/mechanical tilt in adolescence (e.g., Coyle, 2022a, 2023, 2025a; see also, Kell et al., 2013; Lakin & Wai, 2020; Wai et al., 2009; Wai & Lakin, 2020), the current study is the first to examine age and sex differences in ability tilt (math minus verbal) in adolescence. Ability tilt is based within subject differences in math and verbal abilities, yielding math tilt (math > verbal) and verbal tilt (verbal > math). The lack of research on ability tilt in adolescence is surprising, for two reasons. First, unlike technical, spatial, or mechanical abilities, math and verbal abilities (contrasted in ability tilt) are integral to school curricula, which typically focus on developing these abilities rather than technical or spatial abilities. Second, math and verbal tilt show robust sex differences on college aptitude tests (e.g., SAT and ACT), with males showing math tilt and females showing verbal tilt (Coyle et al., 2015; Lubinski, 2016; Wai et al., 2018). Such differences have been attributed to sex differences in vocational preferences in math and verbal domains, with males investing more in math domains and females in verbal domains (e.g., Coyle & Greiff, 2021, 2023; see also, Lippa, 1998; Stewart-Williams & Halsey, 2021; Su et al., 2009; von Stumm & Ackerman, 2013; Wai et al., 2009; Wai & Lakin, 2020). The sex differences may be magnified with sustained investment over time, boosting sex differences in math-verbal tilt in adolescence (Coyle, 2018a, p. 12; see also, Coyle, 2015, 2025a; see also, Brown et al., 2021).
In sum, the current study is the first to examine (a) age differences in ability tilt (math minus verbal) in adolescence; (b) whether sex differences in ability tilt increase with age; and (c) whether speed and g mediate age differences in ability tilt for males and females. To address these issues, math-verbal tilt was examined from 13- to 17-years using data from the 1997 National Longitudinal Survey of Youth (NLSY). Whereas prior tilt research has examined age and sex differences in technical, spatial, and mechanical tilt (Coyle, 2018a; Coyle & Greiff, 2021; see also,Coyle, 2019, 2022a, 2022b, 2023, 2025a), no research has examined analogous differences in math-verbal tilt in adolescence, the age range and tilt type examined here. The NLSY includes 12 cognitive tests from the ASVAB, which measured math ability, verbal ability, processing speed, and g. Following prior research (e.g., Coyle & Greiff, 2021; Lubinski, 2009, 2016), ability tilt was based on within subject differences in math and verbal scores, producing math tilt (math > verbal) and verbal tilt (verbal > math). Processing speed was based on two speed tasks: coding speed, in which participants complete a simple coding chart (matching digits and letters) as quickly as possible, and numerical operations, in which participants solve simple addition problems (e.g., 5 + 3 = ?). Such tasks have been used widely to measure age differences in processing speed (Kail, 1991, 2000; Salthouse, 1996). Following convention, g was based on all cognitive tests (excluding the speed tests).
There were three predictions, all based on investment and cascade theories.
-
The first prediction was that levels of math and verbal tilt would differ for males and females, with males showing math tilt and females showing verbal tilt. Such a prediction is consistent with vocational preference and investment theories (e.g., Coyle & Greiff, 2021, 2023; see also, Lippa, 1998; Stewart-Williams & Halsey, 2021; Su et al., 2009; von Stumm & Ackerman, 2013). Such theories assume that males invest in math-loaded STEM fields, yielding math tilt, while females invest in verbally-loaded humanities fields, yielding verbal tilt.
-
The second prediction was that levels of math and verbal tilt should increase with age (from 13- to 17-years), a pattern consistent with the cumulative effects of investment in specific abilities that produce tilt (Coyle, 2018a, 2018b; Coyle & Greiff, 2021, 2023; see also, Coyle et al., 2011; Coyle, 2022a, 2023, 2025a). In addition, the age-related increases in tilt were expected to vary with participants’ sex, with males showing increases in math tilt and females showing increases in verbal tilt. Such a pattern is consistent with differential investment in STEM (producing math tilt) and humanities (producing verbal tilt) for males and females (Coyle, 2018a; Coyle & Greiff, 2021, 2023; see also, Coyle et al., 2015; Lubinski, 2016; Wai et al., 2018).
-
The third prediction was that the age differences in math-verbal tilt would be explained by processing speed and g, with processing speed boosting g and g boosting tilt. Such a prediction is consistent with cascade theories of tilt, which assume that speed boosts g, which in turn boosts specific abilities that produce tilt (Coyle et al., 2011; Coyle, 2022a, 2023, 2025a; Fry & Hale, 1996; Tourva & Spanoudis, 2020). Because the effects of speed and g on tilt were expected to be similar for males and females (cf. Coyle, 2022a, 2023, 2025a), no sex differences in these effects were expected.
Method
Participants
Participants were drawn from the 1997 NLSY (N = 8989; Hering & McClain, 2003, pp. 1–14), a representative sample of adolescents born in the United States between 1980 and 1984. There were 1365 13-year-olds (705 males, 660 females), 1415 14-year-olds (738 males, 677 females), 1434 15-year-olds (731 males, 703 females), 1468 16-year-olds (725 males, 743 females), and 1287 17-year-olds (628 males, 659 females). Whereas prior tilt research examined the development of tech tilt and mechanical tilt (Coyle, 2022a, 2023, 2025a), the current study was the first to examine the development of ability tilt (math minus verbal) for males and females in adolescence. All participants had scores on the 12 tests of the ASVAB.
Cognitive Tests and Abilities
ASVAB tests and abilities. Processing speed, g, and tilt were based on ASVAB. The ASVAB consisted of 12 cognitive tests, two speed tests and 10 power tests. The two speed tests were coding speed (CS), which measured the speed of completing a coding chart; and numerical operations (NO), which measured the speed of solving simple arithmetic problems, mostly with single digits (e.g., 4 + 3 = ?). The 10 power tests were (in alphabetical order): arithmetic reasoning (AR), which measured the ability to solve math word problems; assembling objects (AO), which measured the ability to identify objects in scattered puzzle pieces; automotive information (AI), which measured knowledge and understanding of automobile parts and technology; electronics information (EI), which measured knowledge and understanding of electronics; general science (GS), which measured understanding of concepts in physical and biological sciences; math knowledge (MK), which measured the ability to solve math equations; mechanical comprehension (MC), which measured mechanical reasoning and understanding mechanical principles; paragraph comprehension (PC), which measured reading comprehension of short paragraphs; shop information (SI), which measured knowledge and understanding of shop tools, devices, and practices; word knowledge (WK), which measured understanding of the meaning of words.
The ASVAB power tests were presented using an adaptive procedure that calibrated item difficulty with participant ability level. The speed tests were presented using a non-adaptive procedure that presented items in the same order to all participants. The power tests were scored using item response theory statistics, with higher scores indicating better performance. The speed tests were scored using number of correct items, after adjusting for guessing and item completion time. All ASVAB scores were standardized (M = 0, SD = 1) prior to analyses.
Ability tilt. Ability tilt was based on ASVAB tests of math ability and verbal ability. Math ability was based on the average of arithmetic reasoning and math knowledge scores. Verbal ability was based on the average of general science, paragraph comprehension, and word knowledge scores. The ASVAB tests of math and verbal abilities have been validated using structural equation modeling and confirmatory factor analysis (e.g., Coyle & Pillow, 2008; Ree & Carretta, 1994; see also, Coyle et al., 2014, 2015; Schmidt, 2011).
Following prior tilt research (Coyle, 2016; Coyle et al., 2014, 2015; Lubinski et al., 2001; Park et al., 2007), ability tilt difference scores were computed by (a) standardizing math and verbal scores in the full sample (M = 0, SD = 1), and (b) computing within subject differences in math and verbal scores (math minus verbal). Positive scores indicated math tilt (math > verbal). Negative scores indicated verbal tilt (verbal > math). Tilt scores of zero indicated no tilt. All individuals showed some degree of tilt, indicated by tilt scores deviating from zero.
There were three additional tilt measures, all based on ability tilt difference scores (math minus verbal): absolute tilt scores, math tilt scores, and verbal tilt scores (cf. Coyle, 2025b, 2025c). Absolute tilt scores were based on the absolute value of ability tilt difference scores (i.e., |math minus verbal|), with higher (positive) scores indicating more tilt. Absolute tilt scores measured degree of tilt, irrespective of tilt type (i.e., math tilt or verbal tilt). Math tilt scores were based on the subsample showing positive tilt scores, indicating math tilt (math > verbal). Verbal tilt scores were based on the subsample showing negative tilt scores, indicating verbal tilt (verbal > math). Unless otherwise stated, analyses of tilt scores for the verbal tilt subsample were performed after converting verbal tilt scores from negative to positive so that higher scores indicated more verbal tilt.
Processing speed. Following prior research (Coyle, 2022a, 2023, 2025a; Coyle et al., 2011), processing speed was based on the two ASVAB speed tests, coding speed and numerical operations. Such tests are widely used to examine age differences in processing speed (e.g., Kail, 1991, 2000; Salthouse, 1996). For correlations, speed was based on the average of coding speed and numerical operations. For structural equation modeling, speed was modeled as a latent variable based on coding speed and numerical operations (see below).
g. Following convention (e.g., Frey & Detterman, 2004; see also, Coyle & Pillow, 2008; Koenig et al., 2008), g was based on the first factor of an exploratory factor analysis (no rotation) of the 10 non-speeded ASVAB power tests. g factor scores were computed for each individual using regression.
Statistical Analyses
Mean age and sex differences in tilt were analyzed using analyses of variance (ANOVAs) and t tests, with age and sex as between subjects factors and tilt scores as dependent variables. Correlations examined relations of tilt with age, sex, and other variables (e.g., processing speed and g). Consistent with investment theories, the main predictions were that (a) sex differences in tilt would be observed, with males showing math tilt and females showing verbal tilt; and (b) age differences would be observed, with tilt levels increasing with age. It was also predicted that sex differences in tilt would increase at older ages due to the cumulative effects of differential investment.
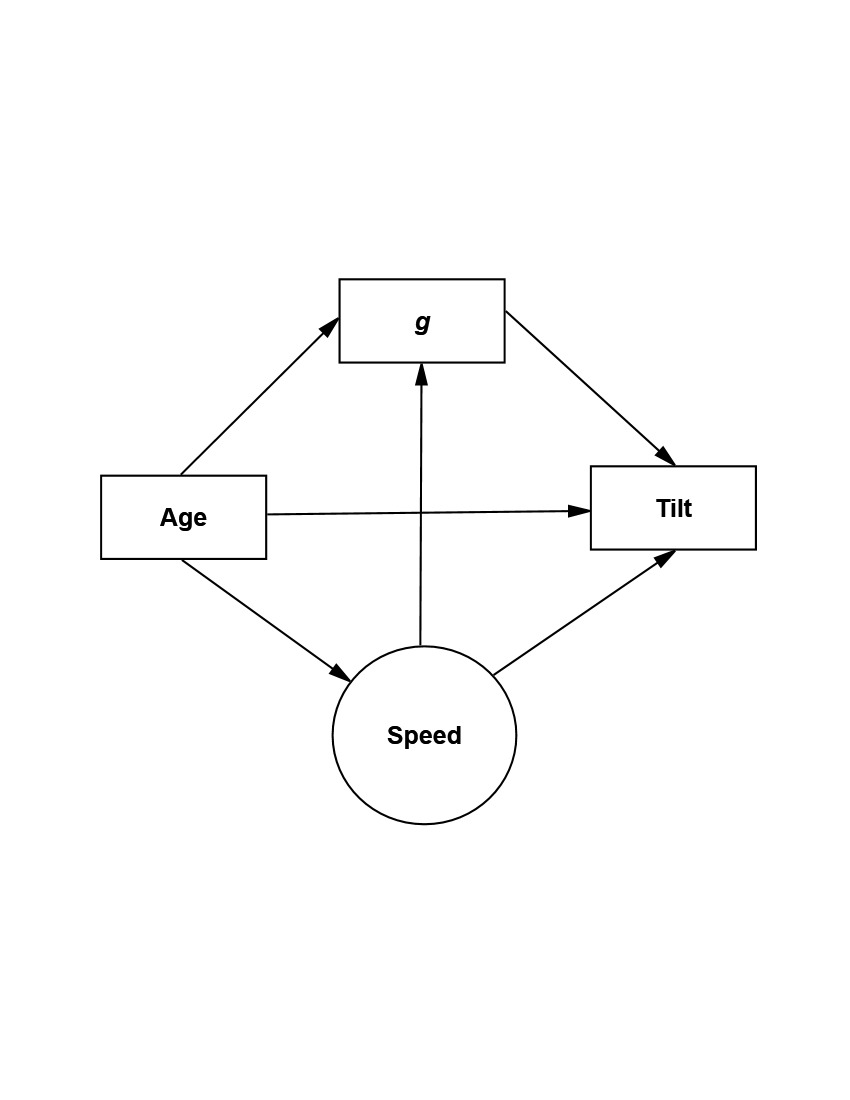
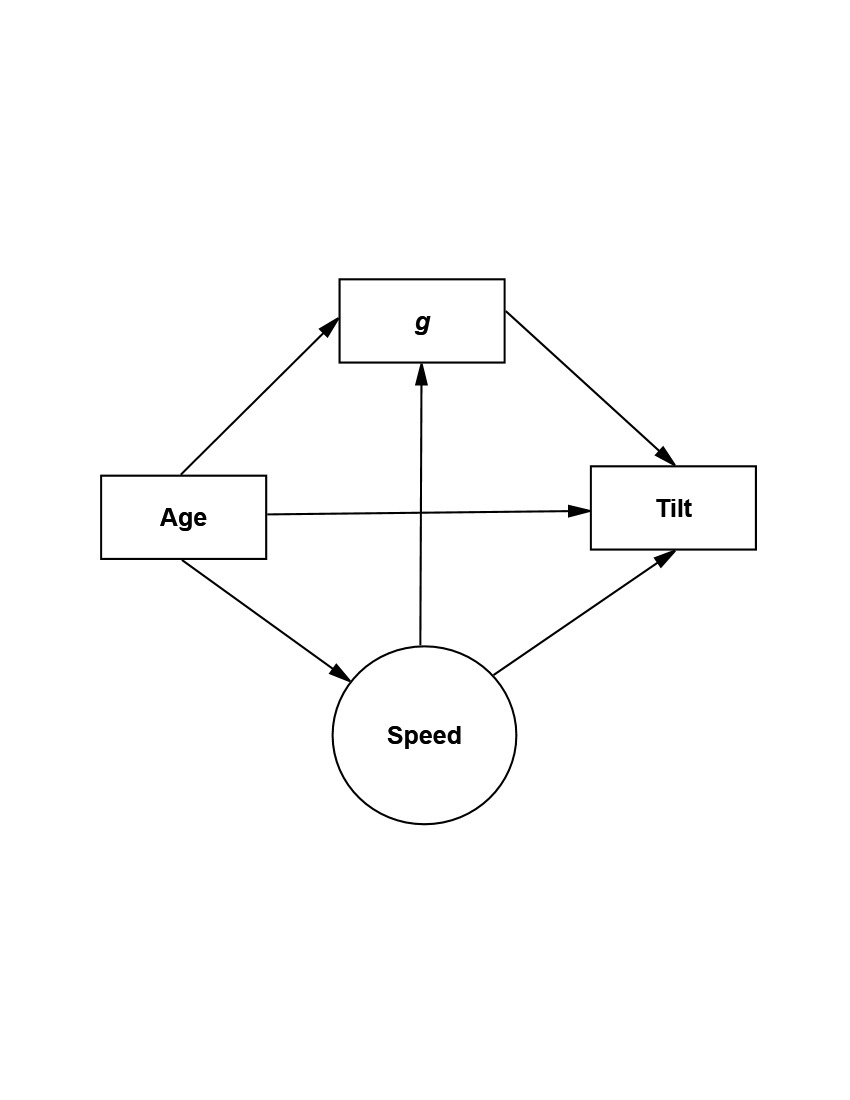
The mediating effects of processing speed and g on age-tilt relations were examined using a cascade model (Fig. 1) and structural equational modeling (SEM).[1] SEM estimated six direct effects (i.e., age on tilt, age on speed, age on g, speed on g, speed on tilt, and g on tilt). SEM also estimated indirect (mediating) effects of speed and g (alone and in combination) on age-tilt relations. Based on investment theories, tilt was expected to increase with age, and speed was expected to mediate age-tilt relations, both alone and with g. Such predictions align with cascade theories, which assume that age-related changes in speed boost g, which in turn boosts specific abilities that produce tilt.
Results
Mean Levels of Ability Tilt by Sex and Age of Participant
Appendix A reports mean levels of tilt for females and males in each age group (i.e., 13- to 17-year-olds). Four tilt scores were analyzed: (a) tilt difference scores (Math-Verbal), with positive scores indicating math tilt and negative scores indicating verbal tilt; (b) math tilt, based on the subsample showing math tilt (math > verbal); (c) verbal tilt, based on the subsample showing verbal tilt (verbal > math); and (d) absolute tilt difference scores (|Math-Verbal|), with higher scores indicating more tilt, irrespective of type of tilt (i.e., math tilt or verbal tilt). As noted, verbal tilt scores were changed from negative to positive so that higher scores indicated more verbal tilt.
The sex differences in tilt at each age were examined using t-tests (tF-M) and ds (dF-M) (Appendix A). Based on investment theories, math tilt was predicted to be higher for males than females, while verbal tilt was predicted to show the opposite pattern. Contrary to predictions, significant sex differences in tilt were sparse and inconsistent, with males showing more verbal tilt than females at age 14 years (d = -.15) and higher absolute tilt scores than females at ages 14 (d = -.12), 16 (d = -.11), and 17 (d = -.14) years. The significant tilt results were largely replicated by correlations of sex with tilt scores at each age before controlling for any variables (rsex) and after controlling for processing speed (prsex.speed) or g (prsex.g). Despite mostly nonsignificant sex differences, tilt levels were higher for males than females at all ages (13- to 17-years) for math tilt (d = -.14 to -.02), verbal tilt (d = -.15 to -.11), and absolute tilt (d = -.14 to -.07).
Appendix A also reports tilt differences from zero (indicating no tilt) within each sex by age group. These differences were examined using t-tests (ttilt-0) and ds (dtilt-0), within each sex by age group. In contrast to the mostly nonsignificant sex differences in tilt, three types of tilt (math tilt, verbal tilt, and absolute tilt scores) differed significantly from zero (ttilt-0) for both sexes (at all ages), with the differences being very large for females (d = 1.20 to 1.32) and males (d = 1.27 to 1.41). Finally, sex differences in mean levels of processing speed (favoring females) were significant at all ages (d = .27 to .36), and sex differences in g (favoring males) were significant at 16 (d = -.18) and 17 years (d = -.25).
Table 1 reports 2 (sex: male or female) × 5 (age: 13-17 years) analyses of variance (ANOVAs) for mean levels of tilt. The analyses were performed separately for each type of tilt (i.e., Math-Verbal, Math Tilt, Verbal Tilt, |Math-Verbal|). (As noted, verbal tilt scores were changed from negative to positive so that higher scores indicated more verbal tilt.) The analyses yielded significant main effects of sex and age for most tilt measures but, contrary to predictions, no significant sex × age interactions, indicating that sex and age effects were independent. (Supplemental and parallel analyses that controlled for g and speed yielded a similar pattern of results.[2])
Table 2 (No Covariates) reports the results for the main effects of sex. The results include t-tests and ds for tilt differences from zero (ttilt-0 and dttilt-0) and sex differences in tilt (tF-M and (dF-M). Mean tilt levels were significantly higher for males than females (tF-M) for math tilt (d = -.07), verbal tilt (d = -.13), and absolute tilt (d = -.10), but not for tilt difference scores (d = .04). In addition, tilt levels differed significantly from zero (ttilt-0), indicating no tilt, for both sexes for math, verbal, and absolute tilt, with differences being very large for both males (d = 1.29 to 1.34) and females (d = 1.26 to 1.27). The results indicate that males showed more tilt than females, but that both sexes showed significant degrees of tilt (defined as tilt differing from zero). Although males showed more math tilt than females (as expected), females did not show more verbal tilt than males, which was predicted based on investment theories.
Table 3 (No Covariates) reports the results for the main effects of age. The results include t-tests and ds for tilt differences from zero (ttilt-0 and dttilt-0), computed separately in each age group. Mean tilt levels increased with age (13, 14, 15, 16, 17 years) for tilt difference scores (M = -.04, -.02, .01, .02, .02), math tilt (M = .39, .41, .43, .44, .44), and absolute tilt (M = .40, .41, .43, .44, .43), but not for verbal tilt (M = .42, .42, .43, .44, .42). In addition, tilt levels differed significantly from zero (ttilt-0), indicating no tilt, at each age for math, verbal, and absolute tilt scores, with the differences being very large (d = 1.24 to 1.34). The results indicate a change from verbal tilt (negative scores) to math tilt (positive scores) from 13- to 17-years and overall increases in tilt levels from 13- to 17-years, a pattern consistent with investment theories.
Correlations of Tilt with Sex, Age, Speed, and g
Table 4 reports correlations of tilt with sex (rsex), age (rage), g (rg), and speed (rspeed), using the full sample. (Sex was coded 0 and 1 for females and males, respectively.) The results were consistent with the mean age and sex differences but the effects were mostly small (cf. Tables 2 and 3). First, math tilt, verbal tilt, and absolute tilt (|Math-Verbal|), but not regular tilt scores (Math-Verbal), correlated positively with sex (r = .04 to .05), indicating that males showed more math and verbal tilt than females. Second, math tilt and both tilt difference scores (i.e., Math-Verbal and |Math-Verbal|) correlated positively with age (r = .03 to .06), indicating that math tilt increased with age and that tilt difference scores (Math-Verbal) became more math tilted at older ages. Third, g correlated negatively with math tilt and tilt difference scores (Math-Verbal) (r = -.05 to -.06), indicating that higher levels of g were associated with verbal tilt (for the difference scores) or less math tilt (for math tilt scores). Finally, whereas sex correlated positively with g (r = .06, favoring males) and negatively with speed (r = -.16, favoring females), age correlated positively with both g (r = .29) and speed (r = .19).
Table 5 reports the correlations of tilt with age, g, and speed, separately for males and females. While age correlated positively with g and speed for males and females (r = .28 to .31), age-tilt relations were significant and positive only for math tilt (r = .08) and absolute tilt (r = .04) for males, and for tilt difference scores (r = .05) for females, with the latter effect indicating that older ages were associated with math tilt for females.
Mediating Effects of Speed and g on Age-Tilt Relations for Males and Females
Table 6 reports cascade analyses of age-tilt relations for males and females. The analyses used multigroup SEM to compare analogous effects in males versus females, with particular attention to tilt relations with age that differed for males and females (e.g., math tilt, tilt difference scores, absolute tilt scores; cf. Table 5). Six direct effects (βs) were estimated using the model depicted in Fig. 1: age on tilt (A-T), age on speed (A-S), age on g (A-g), speed on tilt (S-T), speed on g (S-g), and g on tilt (g-T). The analyses also estimated total (unmediated) effects of age on tilt (Total), as well as indirect (mediated) effects of speed on age-tilt relations (A-S-T), g on age-tilt relations (A-g-T), and both speed and g on age-tilt relations (A-S-g-T). Based on cascade models, speed was expected to mediate age-tilt relations (A-S-T), and age-related increase in speed were also expected to boost g, which in turn would boost tilt (A-S-g-T).
Sex differences (male-female) in effects were tested using multigroup SEM analyses and chi-square difference tests (Δχ2). The chi-square difference tests compared an unconstrained model, where an effect was free to differ between males and females, to a constrained model, where the effect was set to be equal for males and females. A significant chi-square difference test indicates that the effect differed between males and females.
Table 6 (Analysis 1) reports multigroup SEM analyses for tilt difference scores (math minus verbal). The scores were based on math minus verbal scores, with positive scores indicating math tilt (math > verbal) and negative scores indicating verbal tilt (verbal > math). The results were similar for females and males. Total effects of age on tilt were small but positive (females, males) for both sexes (.05, .03), suggesting that math tilt increased slightly with age. Standardized path coefficients (females, males) were relatively strong for age to speed (.36, .32), speed to tilt (.63, .68), speed to g (.77, .73), and g to tilt (-.52, -.57). The pattern suggests that age-related increases in speed boosted g, which in turn influenced tilt, a pattern consistent with cascade theories. Consistent with these effects, the strongest mediating effect (females, males) on age-tilt relations was speed (A-S-T) (.23, .21), followed by the effects of both speed and g (A-S-g-T) (-.14, -.13). Chi-square difference tests indicated that only the age-g effect differed for males and females (Δχ2 = 8.38).
Table 6 (Analysis 2) reports multigroup SEM analyses for the absolute tilt difference scores. The scores were based on the absolute value of math minus verbal scores (i.e., |math minus verbal|), with higher positive scores indicating more tilt, irrespective of tilt type. Consistent with the results for the regular tilt difference scores (cf. Table 6, Analysis 1), the absolute tilt difference scores showed small but positive total (unmediated) effects for (females, males) age to tilt (.03, .06), with strong and positive effects for age to speed (.36, .32) and speed to g (.77, .74). In contrast, negligible effects were found for speed to tilt (.03, -.08) and age to g (.01, .06), with significant female-male differences in effects for age to g and speed to tilt (Δχ2 > 4.22). The negligible relations of speed to tilt and g to tilt suggest that neither speed nor g mediated age-tilt relations for absolute tilt difference scores, which is supported by the non-significant mediating effects of speed and g on age-tilt relations (A-S-g-T) for absolute tilt difference scores for both sexes (range = -.02 to .01).
Table 7 (Analysis 1) reports multigroup SEM analyses for the subsample showing math tilt (math > verbal). The analyses indicated weak but positive total (unmediated) effects (females, males) for age to tilt (.04, .08), indicating that math tilt increased slightly from 13- to 17-years for both sexes. In contrast, for both sexes, the analyses of math tilt indicated strong and positive effects for (females, males) age to speed (.37, .35), speed to tilt (.43, .40), and speed to g (.77, .78), as well as strong negative effects for g to tilt (-.38, -.40). The strong effects suggested that speed and g mediated age-tilt relations for math tilt, a pattern supported by the significant mediating effects of speed and g on age-tilt relations (A-S-g-T) for math tilt (females, males) for both sexes (-.11, -.11).
Table 7 (Analysis 2) also reports multigroup SEM analyses for the subsample showing verbal tilt (verbal > math). The verbal tilt scores were converted from negative to positive so that higher scores indicated more verbal tilt. The results were similar to those for math tilt (cf. Table 7, Analysis 1). The analyses of verbal tilt indicated trivial but positive total (unmediated) effects (females, males) of age to tilt (.01, .01), indicating slight age increases in verbal tilt for both sexes. For both sexes, the analyses of verbal tilt indicated strong and positive effects (females, males) for age to speed (.34, .29), speed to tilt (-.42, -.50), and speed to g (.80, .76), as well as strong positive effects for g to tilt (.33 and .38). The strong effects suggested that speed and g mediated age-tilt relations for verbal tilt, a pattern supported by the significant mediating effects of speed and g on age-tilt relations (A-S-g-T) for verbal tilt (females, males) for both sexes (.09, .08).
Discussion
The current study is the first to examine age and sex differences in math-verbal tilt from 13- to 17-years in adolescence. Tilt was based on within-person differences in math and verbal scores on the ASVAB, yielding math tilt (math > verbal), indicating math strength, and verbal tilt (verbal > math), indicating verbal strength. The ASVAB also measured processing speed (based on two speed tests) and g (based on 10 non-speeded tests), which were expected to facilitate the acquisition of specific abilities that produce tilt (e.g., math tilt or verbal tilt).
Predictions were based on vocational preference and investment theories (e.g., Coyle & Greiff, 2021, 2023; see also, Lippa, 1998; Stewart-Williams & Halsey, 2021; Su et al., 2009; von Stumm & Ackerman, 2013). Such theories assume that males and females show different patterns of investment, with males investing in STEM and females in humanities. Based on such theories, males were expected to show math tilt (due to STEM investment), while females were expected to show verbal tilt (due to humanities investment). In addition, given the cumulative effects of investment over time, males were expected to show increases in math tilt from 13- to 17-years, whereas females were expected to show analogous increases in verbal tilt. Other predictions concerned cascade theories, which examine age-related changes in speed and g on tilt. Such theories assume that in adolescence, increases in speed boost g, which in turn boosts specific abilities that produce tilt.
The predictions for sex differences received mixed support. While males showed more math tilt than females (as predicted), males also showed more verbal tilt than females, which contradicts investment theories (Table 2). The results were extended in the analysis of the absolute tilt difference scores, which showed that tilt scores were higher for males than females (irrespective of tilt type). Unlike regular tilt difference scores (based on math minus verbal scores), absolute tilt scores prevent positive tilt scores (indicating math tilt) and negative tilt scores (indicating verbal tilt) from offsetting, providing a measure of overall tilt level (irrespective of tilt type).
The pattern of males being more tilted than females has not been found for tilts based on non-academic abilities such as mechanical tilt (Coyle, 2025a; see also, Coyle, 2019). Mechanical tilt is based on differences in mechanical and academic abilities (math or verbal), yielding mechanical tilt (mechanical > academic) and academic tilt (academic > mechanical). Studies of mechanical-academic tilt show strong sex differences, with males showing mechanical tilt and females showing academic tilt, a pattern consistent with vocational preferences in males and females. In contrast to mechanical-academic tilt, math-verbal tilt contrasts two academic abilities (i.e., math and verbal), both integral to school curricula in the United States. The current results suggest that tilt levels may be higher in males than females (irrespective of tilt type) when schools support the abilities being contrasted (i.e., verbal and math). In the current study, tilt scores were based on verbal and math abilities, which are supported by schools, but omitted mechanical abilities, which are typically ignored in school (Wai & Lakin, 2020).
The finding that males showed higher levels of math and verbal tilt extends the male variability hypothesis (e.g., Esposito et al., 2025; see also, Johnson et al., 2008). This hypothesis assumes that males show more variability in physical and mental traits than females, with variability often measured as the standard deviation of traits for males versus females. Tilt is a measure of intraindividual variability in two abilities (measured as math-verbal tilt in the current study), with higher tilt levels indicating more intraindividual variability in the two abilities. Consistent with the male variability hypothesis, the current study indicated that males showed more variability in the two academic abilities being measured (math and verbal), producing higher tilt levels.
The predictions for age differences in tilt for males and females received mixed support. Based on investment theories, males were expected to show increases in math tilt from 13- to 17-years (due to STEM investment), while females were expected to show increases in verbal tilt (due to humanities investment) (e.g., Coyle & Greiff, 2021, 2023; see also, Su et al., 2009; von Stumm & Ackerman, 2013). Contrary to predictions, age-related increases in tilt did not vary with sex but were observed for math and verbal tilt, which both increased with age (Table 3). The age-related increases in tilt, combined with the non-significant age × sex interactions, indicate that the age effects were independent of participant sex. The observed increases are consistent with investment theories, which assume that continued investment boosts specific abilities, leading to increases in tilt.
The predictions regarding the cascading effects of processing speed and g on tilt were generally supported. According to cascade theories (Fry & Hale, 1996; see also, Coyle, 2022a, 2023; Coyle et al., 2011; Tourva & Spanoudis, 2020), age-related increases in speed boost g, which in turn boosts the specific abilities that produce tilt. Consistent with such theories, age-tilt relations were mediated by speed and g (A-S-g-T), for math tilt and verbal tilt (Table 7, Analyses 1 and 2). The cascade pattern was observed for both males and females, indicating that the mediating effects of speed and g on age-tilt relation were invariant for sex.
A few findings were not expected and deserve further discussion. First, whereas math tilt was positively related to speed and negatively to g in the cascade model (Table 7, Analysis 1), verbal tilt showed the opposite pattern of effects (Table 7, Analysis 2). The effects of math and verbal tilt were observed for both sexes, despite all other effects (i.e., A-T, A-S, A-g, S-g) being similar in sign and size. The difference in effects can be attributed to the ASVAB tests used to measure math tilt and verbal tilt. Math tilt was based on the ability to solve novel math equations (math knowledge) and math word problems (arithmetic reasoning), which require fluid reasoning and processing speed to keep the problem active in immediate memory. In contrast, verbal tilt was based on the ability to access crystallized knowledge (i.e., general science, word knowledge, paragraph comprehension). In the current study, the positive effects of speed on math tilt suggest that speed facilitates novel problem solving, an aspect of fluid intelligence, whereas g (residualized after removing speed and based on the non-speeded power tests) facilitates the retrieval of crystallized knowledge, an aspect of crystallized intelligence. The negative effects of speed and g on verbal tilt and math tilt, respectively, can be attributed to negative suppression (Tzelgov & Henik, 1991), which occurs when a mediator correlates strongly with a predictor and the total effect of a predictor on an outcome is weak, flipping the sign of the effect with the outcome. Such conditions were present in the current study, where the predictor (age-related effects of speed) and mediator (g) were strongly correlated (effect = .76 to .80), and the total effect (age-tilt relations) was weak (effect = .01 to. 08), producing a negative g-tilt effect for math tilt (effect = -.40 to -.38) and negative speed-tilt effect for verbal tilt (effect = -.50 to -.42) (Table 7, Analyses 1 and 2).
A second anomaly concerned sex differences in math tilt and verbal tilt. Whereas prior research has found that males show math tilt and females show verbal tilt (Coyle et al., 2015; Lubinski, 2016; Wai et al., 2018), the current study found that males showed higher levels of both tilt types (Table 2), suggesting that males were more tilted than females (irrespective of tilt type). The difference between prior research and the current study may be due to sampling. Prior research has sampled males and females who are college bound or in college (Coyle et al., 2015; Lubinski, 2016; Wai et al., 2018). Such students may be brighter than average due to selection for high ability (e.g., Blum & Holling, 2017; Breit et al., 2022; Tucker-Drob, 2009) and more likely to show investment based on gender stereotypes, producing stereotypical patterns of tilt. Such a possibility aligns with the gender equality paradox (e.g., Balducci et al., 2024, 2025), which assumes that stereotypical sex differences in traits may increase when males and females receive support to pursue their interests, a situation that may be more likely for brighter (vs. less bright) students. In contrast to prior research, the current study sampled participants from the general population (drawn from the NLSY), regardless of college status. Such participants may be lower in measured intelligence and less likely to show specialization based on gender stereotypes, suppressing stereotypical sex differences in tilt. In the absence of ability specialization, tilt patterns may align with the male variability hypothesis (e.g., Esposito et al., 2025; see also, Johnson et al., 2008), where variability in psychological traits is higher in males than females. The results of current study support such a hypothesis, with intraindividual variability in both math and verbal abilities (measured as math-verbal tilt) being higher in males than females.
A third anomaly concerned the size of the tilt effects that differed from zero (indicating some degree of tilt) for math tilt, verbal tilt, and absolute tilt. These tilt effects were very large for males, females, and all age groups (d = 1.24 to 1.34; Tables 2 and 3). In contrast, analogous effects for regular tilt difference scores (math minus verbal) were near zero (d = -07. to .04), indicating no tilt. The near zero effects are consistent with prior findings that, for regular tilt scores, positive tilt scores (indicating math tilt) and negative tilt scores (indicating verbal tilt) offset in the full sample, yielding the illusion of no tilt (cf. Coyle, 2016, 2025b, 2025c). The pattern of large tilt effects (that differed from zero) for math tilt, verbal tilt, and absolute tilt is consistent with investment theories, which assume that vocational interests increase investment in specific domains (e.g., STEM and humanities), increasing analogous forms of tilt (e.g., math tilt or verbal tilt). Future research should examine whether vocational interests mediate sex-tilt and age-tilt relations. If such relations are mediated by vocational interests, then controlling for vocational interests should neutralize sex-tilt and age-tilt relations.
Future research could also examine factors that influence age and sex differences in tilt. One possibility is to examine whether age and sex effects on tilt vary across the lifespan (i.e., 20- to 80-years). Such a possibility is consistent with age dedifferentiation theories (Blum & Holling, 2017; see also, Deary et al., 1996; Garrett, 1946; Woodley, 2011), which assume that specific abilities should decrease over the lifespan as abilities become more saturated with g and less saturated with unique variance from specific abilities (e.g., math or verbal). An implication is that tilt (which represents a specific ability) should also decline across the lifespan. Based on the current results, the declines may be more pronounced in males, who showed higher tilt levels than females (Table 2), and may therefore experience greater declines in tilt as tilt becomes more saturated with g and less saturated with variance from specific abilities that produce tilt. Another possibility is to examine whether sex and age effects on tilt vary with ability level. Such effects are predicted by ability differentiation theories (cf. Deary et al., 1996; Detterman & Daniel, 1989; see also, Breit et al., 2021, 2022), which assume that specific abilities increase at higher ability levels, which boosts ability specialization that produces tilt. Based on the current results, the observed sex differences in tilt (favoring males) might be magnified for intellectually gifted adolescents, who should show more ability specialization that produces tilt. Such a pattern would be consistent with the male variability hypothesis, which assumes that variability in psychological traits is higher in males than in females (e.g., Esposito et al., 2025; see also, Johnson et al., 2008). Consistent with this hypothesis, ability differentiation may magnify male intraindividual variability in abilities that produce tilt, producing even higher tilt levels (favoring males) at higher ability levels.
Consistent with these suggestions, future research could examine sex differences in tilt across the extreme tails of the ability distribution. The current study used the NLSY97, a general-population sample that does not specifically target individuals at the extreme ends of the ability distribution. Future studies could therefore examine tilt in gifted samples (e.g., individuals in the top 1% of the ability distribution) and in samples with very low levels of cognitive ability. Based on ability differentiation theories, tilt levels and sex differences in tilt may be most pronounced among gifted individuals, who should show greater specialization of specific abilities, but least pronounced among individuals with very low levels of cognitive ability, who should show less specialization (cf. Deary et al., 1996; Detterman & Daniel, 1989; see also Breit et al., 2021, 2022). Evidence consistent with this prediction comes from research examining differences in math-verbal tilt in gifted samples using the SAT, ACT, and other academic aptitude tests (Wai et al., 2018) and in samples taking the Graduate Record Examination (Wai et al., 2022), a widely used graduate-school admissions test in the United States. In contrast, sex differences in tilt have not been examined in samples with very low levels of cognitive ability. Furthermore, tech tilt—which contrasts academic abilities (verbal or math) with a composite of nonacademic abilities (e.g., shop, mechanical, and electrical)—has not been examined in gifted samples or samples with very low levels of cognitive ability.
Separately, the current study was based on the 1997 cohort of the NLSY97, a representative sample of U.S. adolescents born between 1980 and 1984 and assessed at ages 13 to 17 years. Because the NLSY97 may differ from other cohorts, future research could examine tilt in more recent or earlier cohorts of individuals who are similar in age but were born at different times. If ability specialization has increased in more recent cohorts because of factors such as increased educational specialization, tilt levels—which reflect within-person differences among specific abilities—might also increase. This possibility could be examined by comparing tilt levels across cohorts using international student-assessment programs such as the Program for International Student Assessment (PISA) and the Trends in Mathematics and Science Study (TIMSS), which assess students at different ages and grade levels (cf. Andrzejewski et al., 2024; see also Becker et al., 2022, 2024; Becker & Coyle, 2026). If ability specialization has increased in more recent cohorts, then tilt levels and sex differences in tilt may also be more pronounced in those cohorts.
Finally, the current study examined the relation between speed and age-related changes in tilt using a cross-sectional correlational design, in which different participants were assessed at different ages. Such a design cannot establish the longitudinal ordering of changes in speed, investment, and tilt that is relevant to investment theories (e.g., Coyle & Greiff, 2021, 2023; von Stumm & Ackerman, 2013). These theories propose that prolonged investment in a particular domain should precede and contribute to the development of ability specialization and tilt. Future longitudinal studies could track investment in specific domains (e.g., STEM and humanities) and examine whether domain-specific investment is followed by corresponding changes in tilt. For example, investment in STEM fields might be expected to increase math tilt, whereas investment in the humanities might be expected to increase verbal tilt, with such patterns being observed in both males and females who pursue these domains. Future research could also track tilt longitudinally before and after individuals select a college major and complete college (cf. Wai et al., 2018, 2022). Prolonged and focused study within a particular domain may produce differential development of specific abilities and, consequently, corresponding forms of tilt.
Conclusion
The current study was the first to examine age and sex differences in ability tilt in adolescence from 13- to 17-years. Ability tilt was based on math minus verbal scores on the ASVAB, yielding math tilt (math > verbal), indicating math strength, and verbal tilt (verbal > math), indicating verbal strength. Predictions were based on vocational interest and investment theories, which assume that investment in specific domains (e.g., STEM or humanities) boosts some abilities at the expense of others, leading to tilt. Based on such theories, males were expected to show age-related increases in math tilt and females were expected to show increases in verbal tilt. Contrary to predictions, males showed higher levels of both math and verbal tilt, and age-related increases in tilt did not vary with sex. The results suggest that when investment in specific domains (e.g., math and verbal) is supported by schools, males show more tilt (irrespective of tilt type) and both sexes show age-related increases in tilt. Future research should examine factors that influence tilt. Such factors include age increases over the lifespan, which should minimize specific abilities that produce tilt, and increases in ability level, which should strengthen specific abilities (and yield more tilt) at higher ability levels.