In developed economies, individuals’ academic competencies at the end of secondary schooling, and cognitive abilities more generally, contribute to their economic and social success (Bynner, 1997; Ree & Earles, 1992; Ritchie & Bates, 2013; Rivera-Batiz, 1992). Moreover, well-educated populations experience gains in national economic development (Hanushek & Woessmann, 2008; Rindermann, 2018; Rindermann & Becker, 2018) and higher levels of community functioning (Richmond-Rakerd et al., 2020). In a large-scale analysis of cross-national differences in student achievement, Gust et al. (2024) estimated that two out of three of the world’s students are not developing the basic academic competencies needed to be successful in the modern world. These at-risk students include the majority of children and adolescents in low-income nations and up to one in four children and adolescents in high-income nations. They estimated that broad improvements in children’s academic development could add more than $700 trillion to the world economy by 2100.
These gains will require improvements in educational outcomes, but such gains will require more than just modifying instructional approaches or extending schooling, especially in low-income nations. This is because academic and cognitive performance is influenced by broader living conditions. An example is provided by the Flynn effect whereby improvements in living conditions over the past century in developed nations have been associated with cross-generational gains in educational outcomes and cognitive performance (Dickens & Flynn, 2001; Flynn, 1984; Pietschnig & Voracek, 2015; Sauce & Matzel, 2018; Shakeel & Peterson, 2022). These cross generational gains are well documented and likely due to multiple factors (Pietschnig & Voracek, 2015). Expanding educational opportunities and length of schooling are likely contributing factors (Ceci, 1991; Ritchie & Tucker-Drob, 2018), as are improvements in general health and nutrition that will enhance students’ potential to gain from schooling (Asmare et al., 2018; Daley et al., 2003; Lynn, 1998; Pollitt et al., 1995).
Population differences in height are recognized as a reliable measure of overall nutritional adequacy and general physical health during development (Tanner, 1992). However, while heights increase as populations become healthier, they increase more rapidly for men than women (Giofrè et al., 2025; Halsey & Geary, 2025). As a result, the healthiest populations have the largest sex differences in height, and the most stressed populations have the smallest differences (Perkins et al., 2016). During prenatal development, boys have a steeper growth trajectory than girls, resulting in boys being about 1.6 percent longer than girls at birth (Galjaard et al., 2019). However, poor maternal nutrition and poor nutrition and illness during the two first two years of life compromise boys’ growth more than that of girls which results in higher risk of stunting (i.e., very low height) and compromised adult height (Thurstans et al., 2022). These occur because poor early growth is associated with slower growth during childhood along with delayed pubertal onset and less growth during puberty (Liu et al., 2000). Boys’ greater vulnerability to height deficits when living conditions are poor makes national levels of height sexual dimorphism a useful and sensitive indicator of population health during development, especially during prenatal development and the first few years of postnatal life.
Sex differences in height might be an even more useful measure than absolute height of a population’s nutritional adequacy and health (Geary, 2015; Giofrè et al., 2025). Assessing sex differences in height has the advantage of comparing men and women in the same population, that is, this strategy attenuates the potential confound of inherent population differences in average height. Sexual height dimorphism also has the advantage of being a direct indicator of individual-level health during development as contrasted with broader national measures of health and disease burden such as the Human Development Index (Emadi et al., 2021).
We first examined the cross-national relations between height sexual dimorphism and academic performance using achievement scores based on international academic assessments and provided by the World Bank (below), and height data from a prior study and the World Health Organization (Giofrè et al., 2025; Prendergast & Humphrey, 2014). We then examined within-nation regional differences in height sexual dimorphism and varation in achievement or cognitive performance for seven nations. If early health is related to later academic potential, then nations or within-nation regions with larger height sexual dimorphisms will show higher scores on achievement measures than nations with smaller dimorphisms.
The approach also allows for a nuanced assessment of the relation between developmental health and academic performance. First, the approach provides an estimate of the proportion of cross-national variance in achievement that is potentially related to nutritional and health factors during development. Second, a non-linear relation between height sexual dimorphism and achievement will emerge if the contributions of gains in health to academic and cognitive performance asymptote. Such a finding would be consistent with slower gains in cognitive performance after populations become relatively healthy (Pietschnig & Voracek, 2015). More generally, the approach will provide unique information on the types of health-related interventions that will be needed to better prepare children to take advantage of educational opportunities, especially those in low-income nations.
Method
Academic achievement scores, as well as adult (at least 18 years old) heights were obtained from published articles and webpages at the level of nations and, when available, regions within nations. For the latter, achievement and cognition scores, along with adult heights, disaggregated by sex, were obtained for all available regions for Brazil, China, India, Mexico, Russia, Chile, and Japan.
Cross-National Analyses
Two datasets of adult height and sexual height dimorphism (mean male height / mean female height) were from Giofrè et al. (2025). The first includes vetted height information from Wikipedia (2024), which resulted in a dataset including 127 countries that were also represented in the achievement dataset (below). The second dataset was from the World Health Organization (Prendergast & Humphrey, 2014) and included 33 countries also represented in the achievement dataset.
For the vetted Wikipedia dataset, each country was categorised by broad dominant ancestral grouping: European, East & Southeast Asian, Indigenous / Mixed Latin American, Middle Eastern / North African, Pacific Islander, South Asian, and Sub-Saharan African. Giofrè et al. (2025) checked all sources provided on the Wikipedia page and deleted data from four countries (representing 2.6% of the data) due to unreliable sources (e.g., newspaper articles): Ecuador, Israel, Kenya and Russia. They also found that variation in sex differences in height across national differences in Human Development Index (HDI) scores were comparable across the vetted Wikipedia and WHO datasets. For the WHO dataset, each country was categorised as: European, Sub-Saharan African, and Other, the latter represented by a small number of mostly Middle Eastern / North African and Indigenous / Mixed Latin American groups.
The national achievement data were test scores available from the World Bank for 2020, representing harmonised assessments including PISA (Programme for International Student Assessment), TIMMS (Trends in International Mathematics and Science Study), PIRLS (Progress in International Reading Literacy Study) and several regional tests, converting them into a common TIMMS-equivalent scale (https://datacatalog.worldbank.org/search/dataset/0038001/harmonized-learning-outcomes-hlo-database). The scale has a mean of approximately 500 and a standard deviation of approximately 100.
Within Nation Analyses
The within nation data were compiled from various sources (below). The combined data are in the Supplementary Materials.
Brazil. Height data per state were obtained for 2013 from the National Health Survey (Pesquisa Nacional de Saúde; PNS) (Sistema IBGE de Recuperação Automática - SIDRA) using the PNSIBGE() package in R. Achievement data were the mean of the mathematics and reading comprehension PISA 2012 scores, obtained from Fuerst and Kirkegaard (2016).
China. Height data were obtained from Lu et al. (2022). Cognitive data were from Lynn and Cheng (2013), based on a 60-item measure like the Stanford-Binet Intelligence Test; the test included verbal, quantitative, and spatial reasoning items. The measure was completed by 63,636 participants across 31 regions.
India. Height data were from Choudhary et al. (2021). Achievement data per state were from Lynn and Yadav (2015), and was an average of five measures covering language, mathematics and science achievement across large samples of 11-to-15-year-olds.
Mexico. Height data were obtained from the National Health and Nutrition Survey 2012 via the Encuesta Nacional de Salud y Nutricion (ENSANUT). Achievement data were the mean of mathematics and reading comprehension PISA tests across the years 2003, 2006, 2009 and 2012 from Fuerst and Kirkegaard (2016).
Russia. Height data for people born between about 1990 and 2009 were obtained from Khafizova et al. (2025). Achievement data were PISA 2015 scores across 42 provinces from Lynn et al. (2017).
Chile. Height data were obtained from Encuesta Nacional de Salud, Chile ENS2016-2017 - Mendeley Data for 2016-17. Achievement data were averaged across national language and mathematics tests, obtained from the Education Quality Agency (Agencia de Calidad de la Educacion; 1.-Presentacion-Agencia-de-Calidad.pdf).
Japan. Height data for 18-year-olds were obtained from Dr Kenya Kura, who had access to the School Health and Statistics Survey (政府統計の総合窓口). Achievement data were from Japan’s national achievement survey of 14-year-olds, and the measure was the sum of mathematics and verbal subtest scores for five of the years between 2007 and 2012 (Fuerst & Kirkegaard, 2016; Kura, 2013).
Analyses
Analyses were undertaken in R, using the lm() function and emmeans package.
Cross-national. First, for each height dataset separately, World Bank TIMMS-equivalent scale scores were regressed against sexual height dimorphism in a simple linear regression where each data point represents a unique country, treated as statistically independent. Second, ancestral category was included to account for possible spatial autocorrelation as per Figueredo et al. (2021) and enabled the testing of the regression relationship within ancestral groupings. To achieve this, we added an interaction term between height dimorphism and ancestral category; category-specific simple slopes were estimated using emtrends() from the emmeans package.
Within nation. For each nation, a simple linear regression between achievement or cognition and sexual height dimorphism was computed, where each individual data point represented a unique region of the country. For Russia, a sole very heavy outlier (Republic of Dagestan; Cook’s distance = 11.7, leverage = 0.83) was excluded from the analysis.
Results
Cross-National
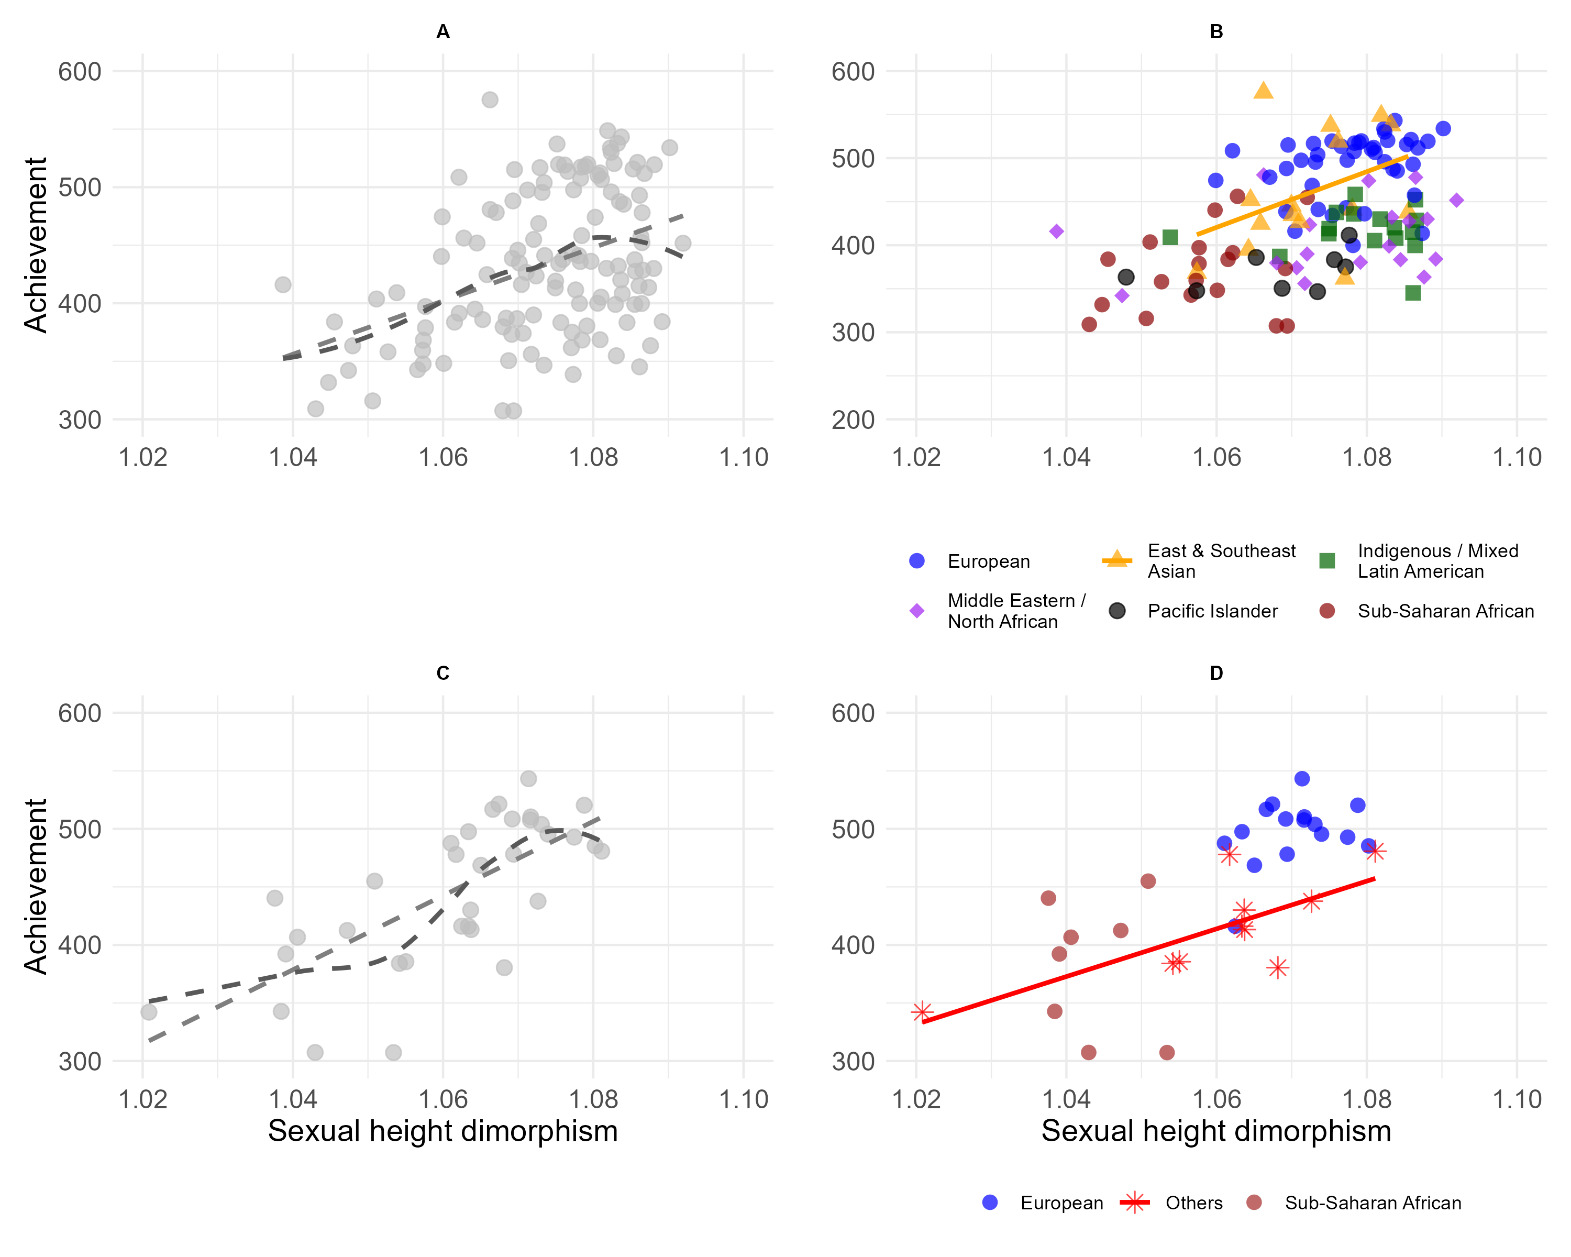
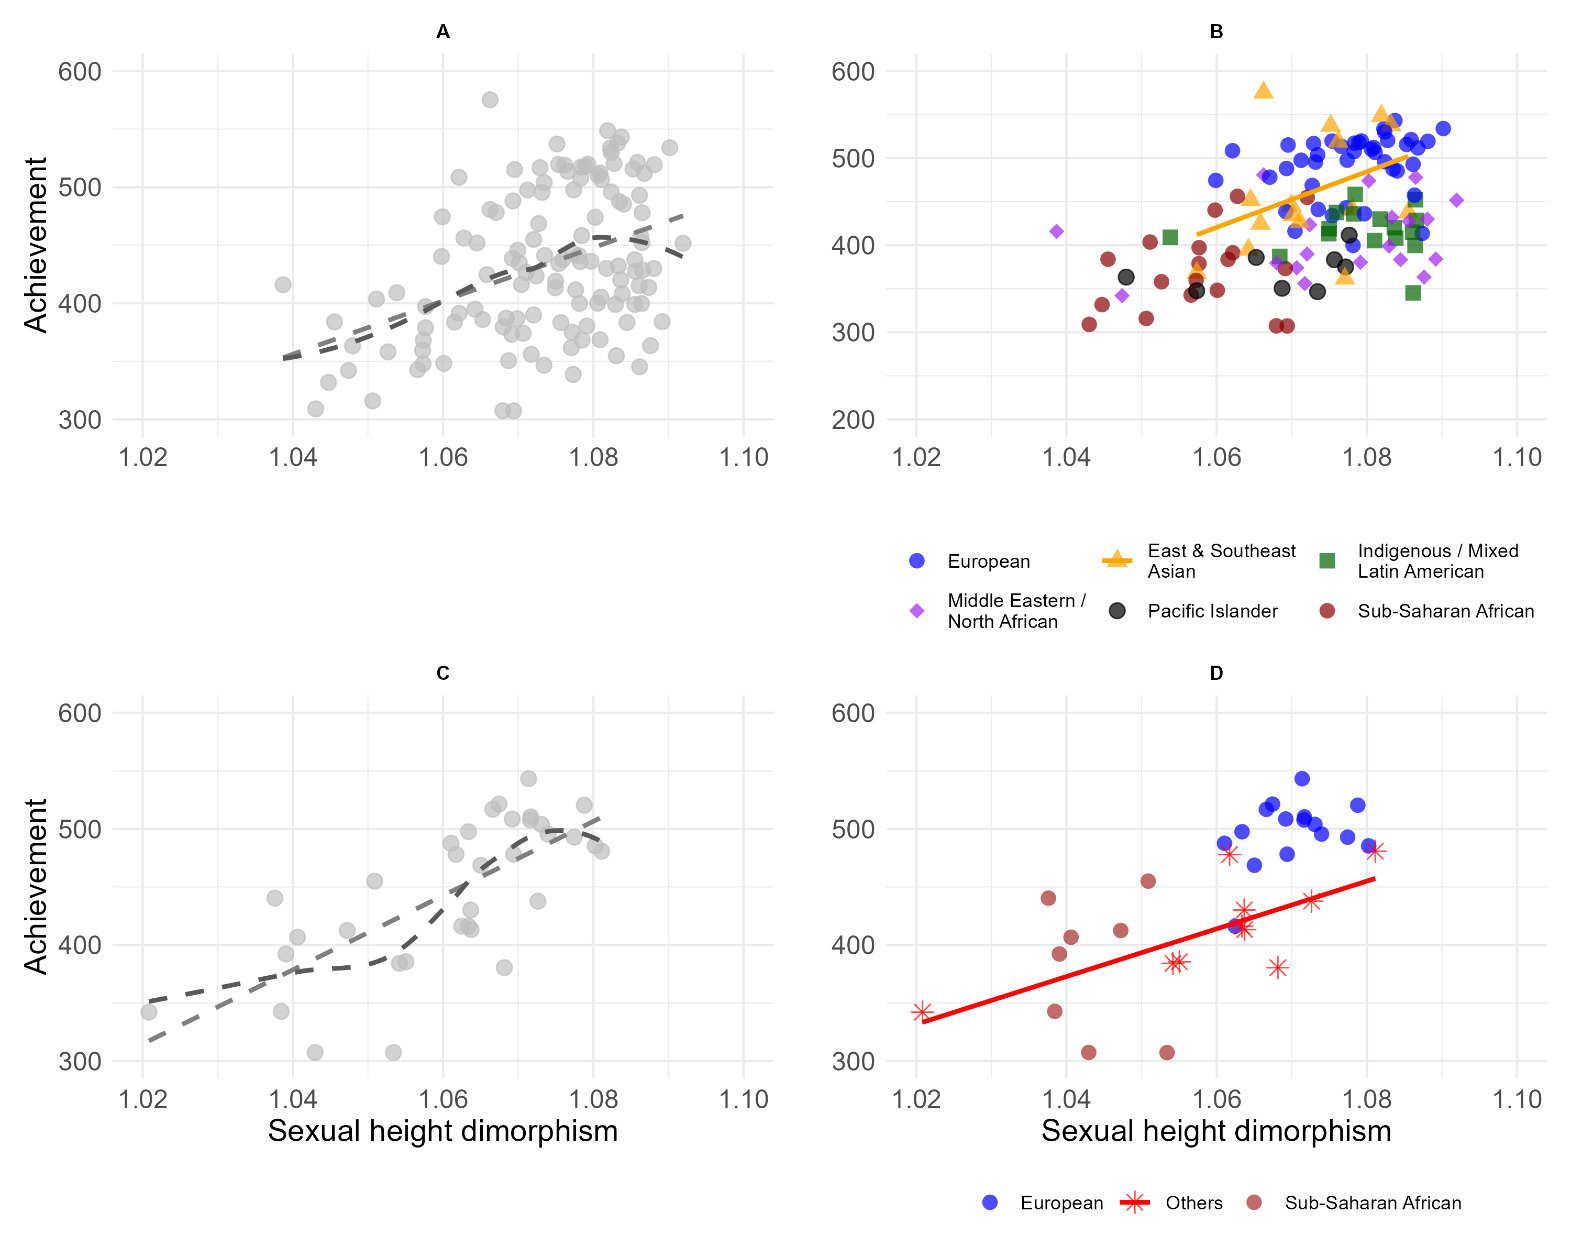
For the Wikipedia dataset, height dimorphism alone was a strong predictor of national differences in overall achievement (r2 = 0.16, p < 0.001; Figure 1A), with an increase in dimorphism of 0.01 related to an increase in mean achievement of 21.7 (d ~ 0.2; Table 1). This will be an underestimate due to inevitable, and likely substantial, regression dilution that results from any measurement error for height dimorphism (Halsey & Perna, 2019).
The Loess curve suggests that gains in achievement might asymptote with height dimorphism at about 1.08 (Figure 1A). Alternatively, non-linearity in the overall relationship across countries could be due to differences between ancestry (Figure 1B). Within ancestral groupings, statistically significant relationships were present only for East & Southeast Asian countries (p =0.02) (Table 1).
For the smaller WHO dataset, height dimorphism alone was again a predictor of overall achievement and in this case a particularly strong one (r2 = 0.49, p < 0.001; Figure 1C; Table 2), with an increase in dimorphism of 0.01 related to an increase in achievement of 32.0 (d ~ 0.3); again, this will be an underestimate (Halsey & Perna, 2019). The Loess curve suggests that gains in achievement are most prominently associated with height dimorphism increases up to about 1.08. Within ancestral groupings, the relationship was significant only for ‘Other’ (Table 2).
Within Nation
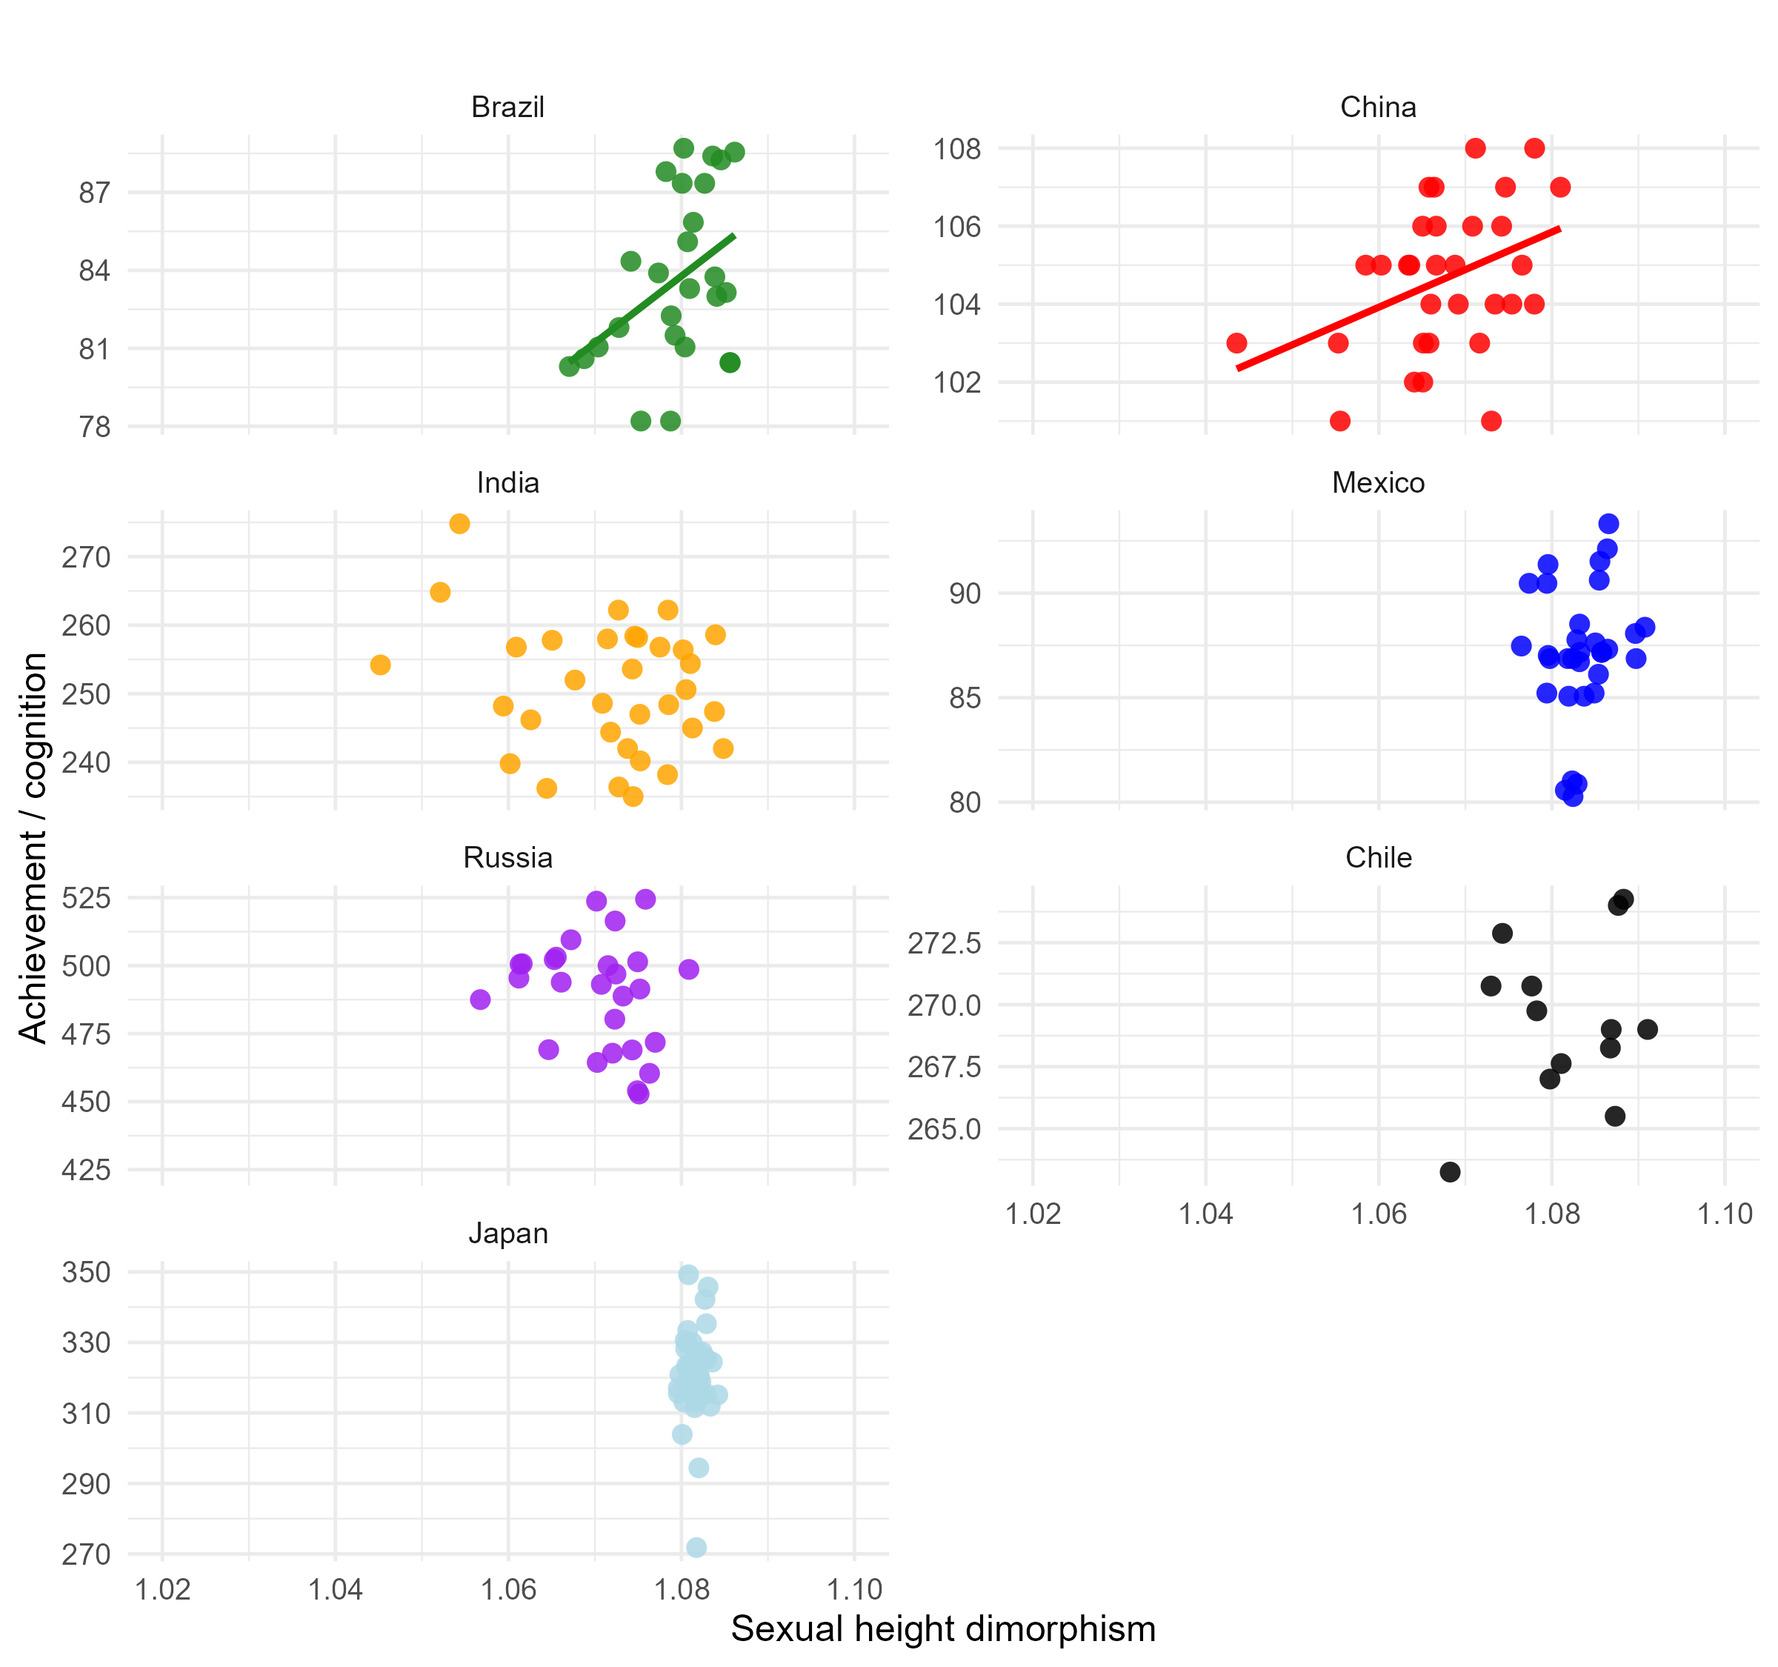
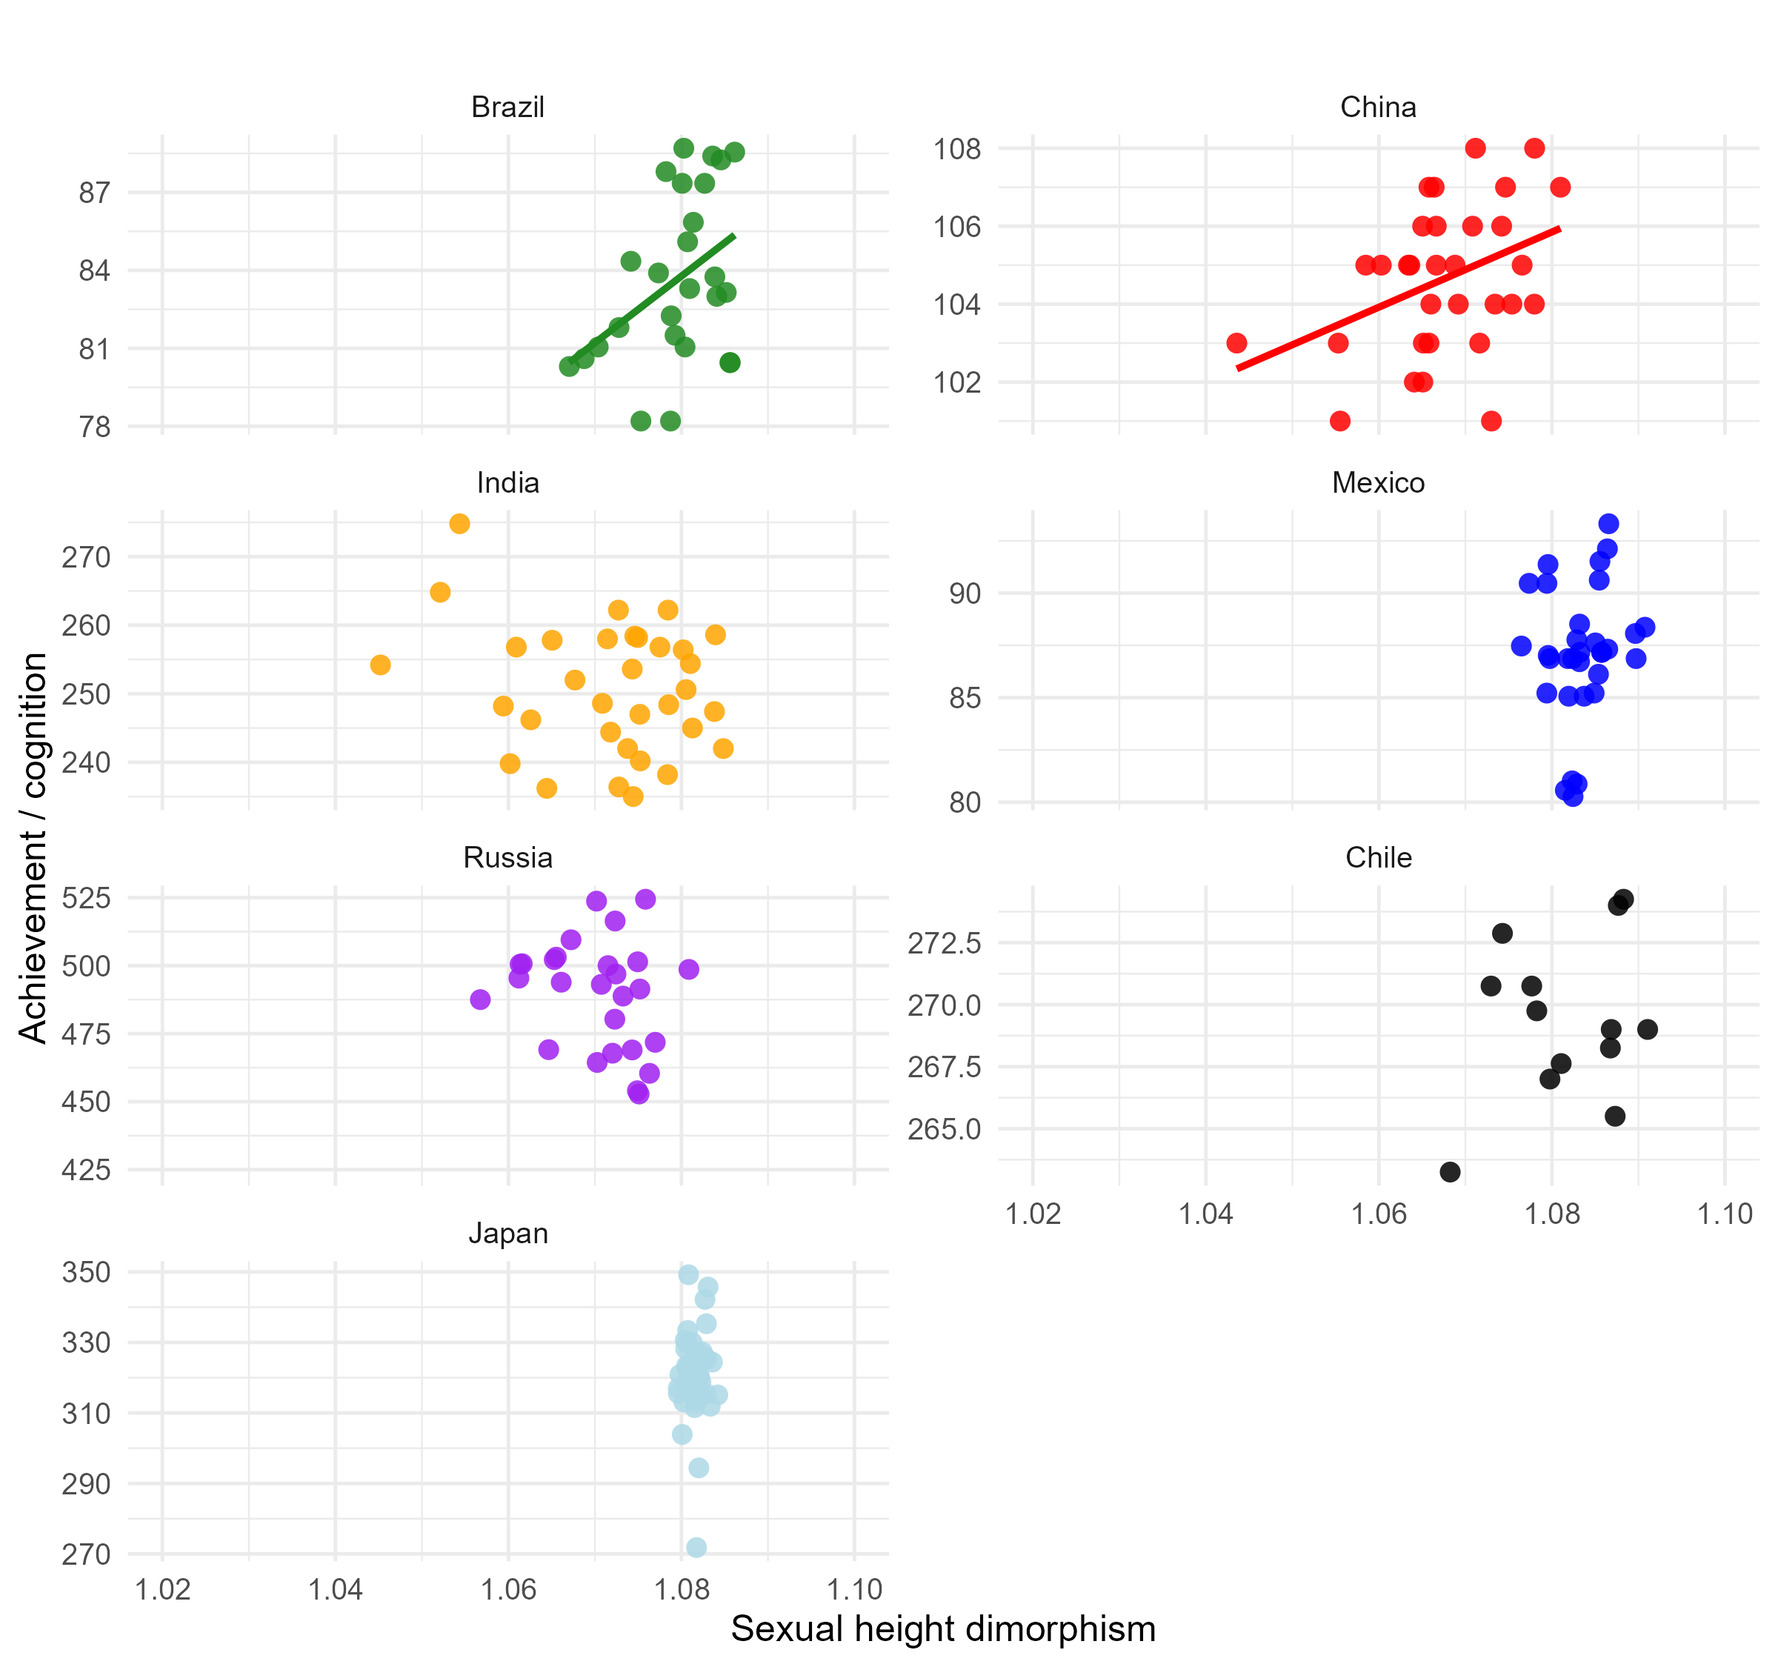
Within nation results are show in Figure 2. Linear regressions of achievement against sexual height dimorphism were significant for Brazil (r2=0.14, p = 0.03, n = 26) and for cognitive ability in China (r2 = 0.13, p = 0.03, n = 31), but not for achievement in India (r2 = 0.02, p = 0.19, n = 33), Mexico (r2 = 0.02, p = 0.43, n = 32), Russia (r2 = 0.05, p = 0.28, n = 28), Chile (r2 = 0.07, p = 0.39, n = 12) or Japan (r2 = 0.00, p = 0.67, n = 47). Most regions within Mexico, Chile, and Japan had sexual height dimorphisms greater than 1.07 and thus close to the asymptote that emerged in the cross-national analyses.
Discussion
Our study provides a unique, biologically informed assessment of the relation between a measure of early developmental health and cross-national differences in academic achievement. The overall pattern suggests that height sexual dimorphism, and by implication developmental health, is potentially a substantial contributor to cross-national variation in academic achievement, with one percent gains in dimorphism broadly associated with noticeable gains in achievement (ds ~ .2 to .3). These results also support the hypothesis inspired by cognitive gains associated with the Flynn effect, that is, these gains are partly related to improvements in health and nutrition (Lynn, 1998; Pietschnig & Voracek, 2015). The cross-national findings also indicated nuance in these relations: gains in health associated with changes in sexual height dimorphisms may only provide gains in achievement up to height dimorphisms of about 1.08, which appears consistent with the research on the Flynn effect showing that cognitive gains asymptote in highly developed nations (Pietschnig & Voracek, 2015).
The results are also consistent with prior studies of the relation between early growth and later educational outcomes (Adair et al., 2013) and follow from the finding that nutrition during prenatal development and then the first few years of life are particularly important for brain development (Coviello et al., 2018; Georgieff et al., 2018). Indeed, Pollitt et al. (1995) found that supplementing mothers and young Guatemalan children (up to age 7 years) with additional calories, protein and nutrients was associated with substantive advantages in academic achievement and general cognitive ability in those children by adolescence (relative to peers with less robust supplements). The gains were especially evident in children from lower socioeconomic backgrounds and increased with years of schooling. The authors concluded that their intervention allowed supplemented children to gain more from later educational experiences.
Nutritional gains are also correlated with gains in height, which makes our measure a sensitive and easy-to-use index of developmental health at the population level (Giofrè et al., 2025; Tanner, 1992). At the individual level, however, there is a trade-off between early height growth and brain development, with rapid gains in the neural uptake of glucose occurring after rapid gains in height (first two years) and peaking at about 4 years of age (Kuzawa et al., 2014). In other words, our height measure will be especially sensitive to health and nutrition during the first two years of life and during adolescence and is related to later academic outcomes. However, it is not fully aligned with key epochs of brain development and therefore interventions that simply focus on gains in height are likely to be insufficient to maximize brain development and learning potential (Georgieff et al., 2018).
During data collation for this study, we also sought datasets at the regional level within nations, however in the main these datasets represented limited ranges of height sexual dimorphism. At first glance, the within nation relations appear to contradict the between nation effects, but on closer inspection this is not the case. The cross-national effects generally asymptote at a height sexual dimorphism of about 1.08 (men being 8 percent taller than women) and, as noted, most of the available within-nation regional data for Mexico, Chile, and Japan were just below or at this cutoff. For the remaining nations, a weak but statistically significantly positive relation between height sexual dimorphism and academic achievement emerged for Brazil and for general cognitive ability for China. There was, however, no such relation for India or Russia. The reasons for this cannot be determined from our data. One possibility is that both these countries have diverse populations that might differ in maximum height sexual dimorphism under healthy conditions, and this could bias our height measure. However, the same could be said for Brazil.
In conclusion, developing nations can anticipate economically relevant gains in academic outcomes through nutrition and health interventions validated by increased height sexual dimorphism. Such interventions are likely to be the most effective for populations with a height sexual dimorphism less than 1.08, and when targeting prenatal development and through the preschool years. Any such interventions are likely to be the most effective if they include calorie and macro and micronutrient supplements that are synchronized with the nutritional needs of different brain regions at different stages of development (see Georgieff et al., 2018). The development of such interventions should increase the learning capacity of at-risk children and when combined with educational improvements have the potential to substantively increase the economic growth of developing nations (Gust et al., 2024).