

Introduction
The Flynn effect describes systematic generational increases in intelligence test performance that were observed throughout much of the 20th century. These gains, typically averaging approximately three IQ points per decade, have been documented across numerous populations and test instruments (Pietschnig & Voracek, 2012). Increases were particularly pronounced in measures of fluid intelligence, while crystallized intelligence exhibited comparatively modest gains.
However, these trends followed a nonlinear trajectory, characterized by alternating periods of accelerated and attenuated growth. Although effect sizes varied across national contexts, the overall direction of changes was consistently positive. More recently, however, accumulating evidence suggests a departure from this trend. Several countries now exhibit deceleration (e.g., United States: Rindermann & Thompson, 2013), stagnation (e.g., Australia: Cotton et al., 2005) or a reversal of the Flynn effect (e.g., Denmark: Dutton et al., 2016; USA: Dworak et al., 2023). However, Dworak et al. (2023) observed substantial domain heterogeneity, with largely stagnating or negative trends in most abilities but a clear positive Flynn effect in their most fluid measure the three-dimensional mental rotation (for an overview see Rodgers, 2023). This suggests that the Flynn effect may no longer yield a universally positive trajectory.
These inconsistent trends in cognitive performance have prompted renewed attention to the theoretical models underlying intelligence research. Contemporary frameworks move beyond global IQ scores and emphasize the structural complexity of cognitive abilities. Central to this perspective is psychometric g, which is a consequence of the positive manifold of cognitive abilities (i.e., consistently positive intercorrelations between virtually all intelligence (sub-)tests). Earlier models, such as Cattell’s theory of fluid and crystallized intelligence (Cattell, 1963, 1987; Horn, 1968), postulated a hierarchical structure, with g at the highest level of abstraction and subordinate correlated broad abilities, but did not differentiate more specific ability domains. However, Cattell’s taxonomy represented over many decades at least implicitly the theoretical underpinning of many cognitive test instruments. Because Flynn effect research depends on archival, typically incidentally collected data, past research on long term cognitive trends was often limited to change assessments in terms of crystallized and fluid as well as fullscale IQ. This limited the capacity to detect differentiated ability changes. Should IQ changes be differentiated according to more specific abilities, as increasingly suggested by contemporary findings (e.g. Lazaridis, 2022), traditional assessments based solely on fluid and crystallized indices would be insufficient to capture these patterns. As a result, the inconsistent trajectories now observed may stem from the increasing availability of subtest-level scores from modern test instruments that allow for the detection of domain-specific variation that may have previously been obscured by cruder metrics.
The Cattell-Horn-Carroll model (CHC) has become one of the most widely accepted intelligence models in the field to date (Cattell, 1963, 1987; Horn, 1968; McGrew, 2018; J. Schneider & McGrew, 2013). This model organizes abilities into a hierarchical structure comprising correlated broad stratum II and narrow stratum I domains that are subordinate to the stratum III g factor. Whilst stratum II represents essentially the same level of abstraction as the fluid and crystallized intelligence sensu Cattell, another fourteen broad domains are assumed in this stratum, each of which comprises multiple narrow abilities (W. Schneider & McGrew, 2022). It is therefore necessary to examine cross-temporal test score changes beyond the more general stratum III and II abilities to account for this more refined understanding of intelligence.
Because cognitive ability tests have become more refined as well, these changes in intelligence assessments may be responsible for the domain-specific trends that have recently begun to emerge in contemporary studies and that may have remained obscured in prior research. For example, recent findings indicate consistent gains in domain-specific knowledge, learning efficiency, and comprehension knowledge. By contrast, negative trends have been reported for spatial orientation and working memory capacity, while processing speed appears to remain largely stable (Lazaridis, 2022). Therefore, investigating domain-specific trajectories, rather than aggregated higher-order scores, is necessary to identify the mechanisms underlying these observed changes.
Similarly, changes in memory-related domains appear to be inconsistent. Some studies report improvements in declarative memory (Rönnlund & Nilsson, 2008), visual recall (Baxendale, 2010), and short-term memory (Wongupparaj et al., 2017), while others suggest stagnation (Gignac, 2015) or even declines in working memory (Lazaridis, 2022). Mixed findings have also been observed for executive function components: Whilst data from the U.S. indicate decreases in attention and working memory (Graves et al., 2021), recent Austrian results suggest moderate gains in selective attention among adults (Andrzejewski, Oberleiter, et al., 2024; Bugelnig et al., 2025). Memory performance has frequently been shown to covary with executive functioning (e.g. McCabe et al., 2010). These observations emphasize the importance of domain-specific analyses in the study of generational cognitive trends and executive functioning provides a theoretically coherent domain for this. Specifically, it is important to examine the Flynn effect on CHC stratum I level to clarify the nature, meaning, and causes of the Flynn effect.
In general, although mean test and subtest scores have generally increased over time, several studies reported a negative association between the Flynn effect and psychometric g (e.g., Must et al., 2003; Pietschnig & Voracek, 2012; Woodley et al., 2014; but see, Colom et al., 2001, for contrasting evidence). This pattern has been interpreted as a consequence of a weakening of the positive manifold of intelligence (Pietschnig et al., 2021). Two concurring hypotheses have been proposed to explain this pattern, both of which may be attributed to an increasing cognitive ability specialization of the general population, due to environmental reinforcement:
On the one hand, it is possible that all specific cognitive abilities have changed in strength at the population level while maintaining their relative importance (i.e., either increasing or decreasing in an identical manner), thereby producing increasingly asymmetric individual cognitive profiles over time (Pietschnig et al., 2021, 2023). This interpretation is consistent with work suggesting that observed declines in the positive manifold may emerge as a consequence of broad, domain-general shifts that affect all abilities simultaneously, albeit to differing degrees (Andrzejewski, Zeilinger, et al., 2024; Oberleiter et al., 2024). On the other hand, some abilities may have become more important than others due to environmental changes (e.g., increased demands on visuospatial processing, reasoning complexity, or digital literacy) resulting in diverging cross-temporal trajectories in which certain domains show gains while others stagnate or decline (Pietschnig, 2025; see also Lazaridis, 2022 for tentative evidence of domain-specific differentiation). abilities yielding increases, whilst others show stagnation or decreases; Pietschnig, 2025). offer plausible mechanisms for how changes in the positive manifold could emerge across cohorts: either because ability profiles become increasingly asymmetric despite all abilities yielding directionally consistent changes (i.e., everyone becomes more specialized, but not in the same way) or because different abilities follow increasingly distinct developmental and societal relevance pathways (i.e., some abilities become more important than others, thus yielding broadly similar specializations and profile asymmetries across individuals). In fact, both of these ideas are consistent with evidence for declines in the strength of the positive manifold that have been observed among child cohorts in France (Lynn & Cooper, 1993), educational datasets in Italy (Pietschnig et al., 2023), and intelligence test standardization samples of Austrian adults (Andrzejewski, Zeilinger, et al., 2024; Oberleiter et al., 2024). Accordingly, it is crucial to systematically investigate changes in the positive manifold cross-temporally to examine their role in these observed ability trends.
One central challenge in Flynn effect research concerns whether observed test score changes represent genuine population level ability differences (i.e., they are consequences of true population ability changes) or reflect a measurement artifact arising from changes in item properties across assessment periods (i.e., measurement invariance). Differential item functioning refers to systematic shifts in item difficulty or discrimination that may result from evolving cultural contexts or test taking behaviors (e.g., Beaujean & Osterlind, 2008; Gonthier & Grégoire, 2022; Wicherts et al., 2004). Without evidence for cross-temporal measurement invariance, such item level changes have been shown to lead to inaccurate change scores in terms of strength and even direction (Gonthier et al., 2021). Consequently, meaningful interpretations of generational score differences require measurement invariance to ensure that observed effects reflect true ability changes rather than differences in item functioning between assessments (Lazaridis, 2022).
Finally, most of the available evidence about test score changes to date is based on rather young samples (e.g., military conscript-based large-scale assessments; Pietschnig & Voracek, 2012), thus leaving the Flynn effect in older adults underexplored. However, Flynn effect research into aging populations is increasing, with accumulating evidence indicating that secular cognitive gains extend into later adulthood and may be strongest in fluid or mixed-process abilities (e.g., Clouston et al., 2021; Dickinson & Hiscock, 2010; O’Keefe et al., 2023; Skirbekk et al., 2013; Zhang et al., 2024). Moreover, systematic investigations of cross-temporal changes of the positive manifold of intelligence remain scarce and are largely limited to specific countries or subpopulations. The present study addresses this gap by means of a cross-temporal analysis of stratum I cognitive ability scores across nine cohorts of adults in retirement age from 22 countries spanning the years 2005 to 2022. In addition, we examine changes in the positive manifold to assess potential changes in population-level cognitive differentiation. To this end, we use archival executive functioning data from the Survey of Health, Ageing and Retirement in Europe (SHARE), a longitudinal dataset that captures individual level data on health, well being, and retirement among individuals aged 50 years and older. The SHARE dataset provides an opportunity to examine whether Flynn effect patterns extend into late adulthood, where gains in fluency and memory would align with established FE trajectories.
Methods
The present study was preregistered on January 22, 2025, before accessing or analyzing any data. The preregistration protocol, supplementary materials, and corresponding analytic code are available on the Open Science Framework (OSF; https://osf.io/5qdrp/).
The Survey of Health, Ageing and Retirement in Europe (SHARE)
We used data from the Survey of Health, Ageing and Retirement in Europe (SHARE; https://share-eric.eu), a large-scale longitudinal survey that collects individual level data on the health, wellbeing, and further characteristics of individuals aged 50 years and older. The survey commenced in 2004, with data collection conducted across multiple waves in an approximately biannual rhythm. Wave 1 data were collected in 2004 and have continued until Wave 9 so far which has been completed in 2022 (Wave 9 release date was March 28, 2024). The SHARE dataset includes representative samples of non-institutionalized individuals aged 50 years and older from 29 countries.
Given the multinational scope of SHARE, all survey instruments were translated into the respective languages of participating countries. A standardized translation procedure was implemented, involving multiple independent translations followed by country-level validation to ensure both linguistic and cultural comparability (Harkness, 2005). The SHARE questionnaire covers a broad range of domains, including demographics, physical and mental health, behavioral risk factors, cognitive functioning, healthcare utilization, financial situation, and social engagement. Data collection involved a combination of face-to-face computer-assisted personal interviews and self-report questionnaires (Börsch-Supan et al., 2013).
For the purposes of this study, we used cognitive functioning data from Wave 1 through Wave 9. The cognitive function battery in SHARE comprises indicators of working memory, free recall, verbal fluency, and basic mathematical reasoning. These measures are generally considered to reflect aspects of executive functioning (e.g. Amunts et al. 2018, McCabe et al., 2010).
Participants
Because we were interested in between-cohort changes, we included only unique participants across all waves. In other words, we omitted all follow-up interview responses of participants who participated in earlier waves but only included newly recruited participants in later waves. At least 100 participants within a country had to participate within a wave to be included in our analyses.
The final sample in the current study consists of 128,610 participants that averaged 64.29 years (SD = 10.11; 52.9% women) from 22 countries. For participant education level we used the International Standard Classification of Education (ISCED; UNESCO, 2011) provided within the SHARE dataset. Within-wave participant characteristics are provided in Table 1 and country-specific characteristics are available from the online supplemental materials S1.
Measures
Memory
In the memory task, participants listen to a list of 10 words once and are then immediately asked to recall as many of them as they can in any order . The number of words recalled equals the resulting score, ranging from 0 to 10. Moreover, delayed recall is assessed by asking participants to recall any of these words after having completed distractor tasks (i.e., the numeracy I and II and verbal fluency tasks). Although SHARE provides an aggregated memory score, we examined immediate and delayed recall separately because they map on distinct Stratum I domains within the Cattell-Horn-Carroll (CHC) framework (J. Schneider & McGrew, 2013). Specifically, immediate recall corresponds to working memory capacity (Gwm-Wc), while delayed recall corresponds to free recall memory (Gl-M6).
Verbal Fluency
Verbal fluency was assessed using a semantic category fluency test, in which participants have to name as many animals as possible within 60 seconds. The total score is the number of correctly generated words. Verbal fluency has been well-established as a measure of executive functioning (Aita et al., 2019), involving cognitive flexibility, strategy formation, and rapid retrieval of semantic knowledge (Barbey et al., 2012). Within the CHC model, this measure as corresponds to Naming Facility (Gr-NA), reflecting rapid lexical retrieval and semantic fluency.
Numeracy
In the numeracy I task, the ability to perform basic numerical operations is assessed by means of four items. Participants are asked to (i) calculate 10% of a certain number; (ii) find half of a number; (iii) compute a number based on two thirds of its value; and (iv) successively add 10% of its own value twice to a certain number. In the numeracy II task, participants’ ability to perform serial arithmetic subtraction is assessed by instructing them to sequentially subtract seven from an initial value of 100, repeating this operation five consecutive times. Both numeracy tasks correspond to Quantitative Reasoning (Gf-RQ) within the CHC framework. Due to the differences in item composition and availability across waves, we analyzed these variables separately, examining the numeracy I variable from Waves 1 through 9, and the numeracy II variable from Waves 4 through 9.
Statistical Analyses
For the purposes of this study, we used data from Wave 1 through Wave 9 wherever available. Although some waves covered two calendar years, the year the survey concluded was used as the survey year. Accordingly, the survey years used for Waves 1 through 9 were 2005, 2007, 2009, 2011, 2013, 2015, 2017, 2020, and 2022, respectively. Values marked as “Don"t know” or “Not answered” were treated as missing for demographic variables and as incorrect responses across all analytical procedures
Given the large sample size of the dataset, conventional null-hypothesis significance testing is of limited interpretive value. Accordingly, here we emphasize the interpretation of effect sizes rather than p-values and adopt the thresholds proposed by Funder and Ozer (2019) to assess the relevance of effects. Effect sizes were interpreted with Cohen d lower effect thresholds as very small (0.10), small (0.20), medium (0.41), large (0.63), and very large (0.87) as well as for η²ₚ as very small (.0025), small (.01), medium (.04), large (.09), and very large (.16), respectively.
We calculated all pairwise standardized mean differences (Cohen d) between the cognitive function scores between between the earliest and latest available measurements available within each country. For ease of interpretation, Cohen d values of raw scores were transformed to changes per decade in the IQ metric (DIQ) via the following formula: DIQ (interval) = [(d × 15)/interval] × 10 (see Lazaridis, 2022). Consequently, positive values of d indicate cross-temporally increasing test performance, thus representing positive Flynn effects, while negative d values represent negative ones.
To evaluate the meaningfulness of observed cross-temporal changes, we assessed measurement invariance using multi group confirmatory factor analysis for scales with appropriate response formats. Measurement invariance indicates whether scales retain the same measurement properties across different groups or time points, and it represents a necessary condition for interpreting observed differences as reflecting true population ability changes rather than measurement artifacts (Meade & Lautenschlager, 2004; Putnick & Bornstein, 2016). Given item level data availability in the SHARE dataset, measurement invariance testing was only feasible for the numeracy II measure. Response formats of the other cognitive tasks precluded formal measurement invariance assessments. Therefore, we interpret raw score-based changes for the remaining measures. This is reasonable because measurement non-invariance is most likely to affect verbal ability domains, but has comparatively little effects on numeracy, fluency, or recall tasks (e.g. Horn & Mcardle, 1992; Wicherts et al., 2004).
To examine changes in the intercorrelation of intelligence subdomains (i.e., the positive manifold of intelligence), we performed a factor analysis (FA), using the subscale scores of the SHARE data separately for each sample. In this vein, we determined the explained variance (R2) of psychometric g in each cohort using a forced single-factor analysis, with subtest factor loadings representing the psychometric g loadings of the positive manifold. Changes in the positive manifold strength were assessed by comparing explained variances (i.e., R2) of the single-factor analysis between the two cohorts. Two separate analyses were performed: In the first analysis, working memory, free recall memory, verbal fluency, and numeracy I were included. In the second one working memory, free recall memory, verbal fluency, and numeracy I and II were included. This was done because the numeracy II variable was introduced to the SHARE dataset only in 2011, limiting its availability to earlier waves. The proportion of explained variance (R²) from each factor solution was used as an indicator of the positive manifold’s strength, with larger R² values suggesting a stronger general factor characterized by higher intercorrelations among the cognitive measures. Between-cohort changes in R² may thus be interpreted as changes in the extent to which cognitive domains are interrelated at the population level (i.e., the positive manifold of intelligence). For cohorts 2011 to 2022, we compared McDonald’s ωh between samples (McDonald, 1999) to examine changes in the g saturation over time (see Revelle & Wilt, 2013).
We examined associations between survey year and cognitive function using weighted linear regression analyses, with weights reflecting cohort specific sample sizes to account for differences in estimate precision. Separate models were conducted for each cognitive domain. Missing data on either independent or dependent variables resulted in casewise exclusion from the respective analyses. To evaluate the extent to which age and education account for observed time trends, we employed hierarchical regression models, entering survey year in the first step and adding participant age and education as predictors in the second and third step, respectively.
All analyses were first conducted across all and subsequently within each country to assess the generality of observed patterns. We used R 4.3.2 for all our analyses (R Core Team, 2023) and psych (Revelle, 2024), ggplot2 (Wickham, 2016) for creating the Figures, and rnaturalearth (South, 2017) for creating heat maps.
Results
Pairwise mean differences
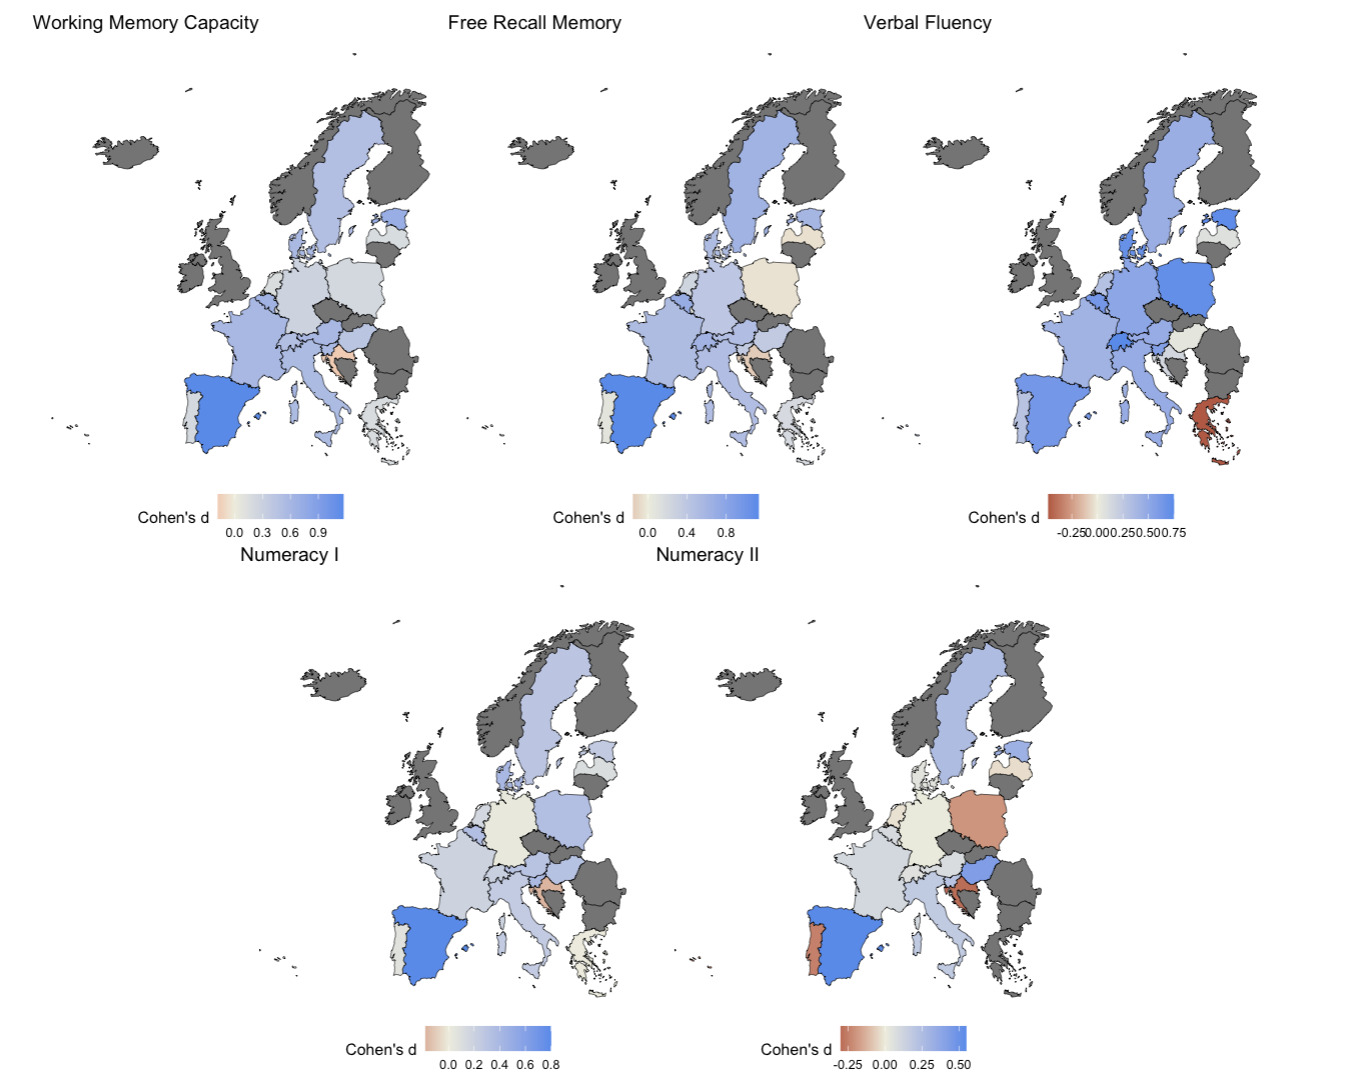
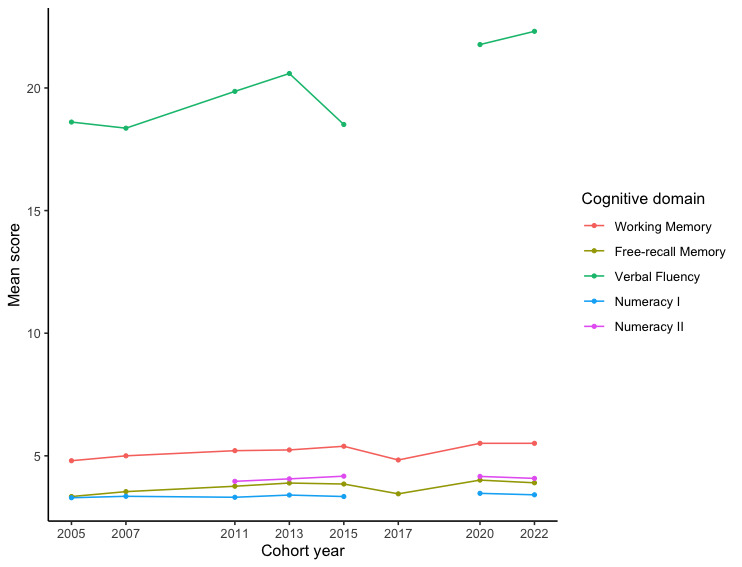
Descriptive statistics for all cognitive function domains across cohorts are presented in Table 2 and displayed in Figure 1. Standardized mean differences based on raw scores from the total sample yielded consistent positive Flynn effects across all assessed domains when comparing the earliest and latest available measurements within each country (Table 3, top row; Figure 2). In the full analytic sample, effect sizes ranged from very small to medium (Cohen’s d = 0.08 to 0.48), corresponding to estimated gains of approximately 0.9 to 4.0 IQ points per decade.

Given that the number and timing of assessment waves varied across countries, all reported effects refer to the interval between the first and last available measurement occasion within each country. Detailed country-specific intervals are reported in Table 3.
When examining domain specific trends, verbal fluency exhibited the most consistent and largest positive effects across countries (d range: 0.15 to 0.90; Table 3). Only three countries deviated from this pattern, with small and large negative effects observed for Israel (d = -0.24) and Greece (d = -0.48), respectively and Hungary showing virtually no change (d = 0.04). Working memory also yielded highly consistent positive effects, with very small to very large effect sizes observed across nearly all countries (d range: 0.13 to 1.17). The only exception was Croatia, where a small negative effect was identified (d = -0.18).
For free recall memory, the results were less consistent. While small to very large positive effects were observed in most countries (d range: 0.19 to 1.13), several countries showed trivial or no change, including Israel, Latvia, Poland, and Portugal (d range: -0.05 to 0.07). Additionally, Croatia again showed a small negative effect (d = -0.15).
Numeracy I yielded small to very large positive effects in the majority of countries (d range: 0.10 to 0.80). However, trivial changes were observed for Germany, Greece, Israel, and Portugal (d range: 0.01 to 0.07). Small negative effects were also identified for Croatia (d = -0.18) and the Czech Republic (d = -0.15).
The least consistent pattern emerged for numeracy II. Some countries exhibited very small to medium positive effects (d range: 0.10 to 0.55), while others, including Croatia, Israel, and Portugal, showed small to medium negative effects (d range: -0.25 to -0.46). Additionally, virtual stagnation was observed for Denmark, Germany, Latvia, Luxembourg, the Netherlands, and Switzerland (d range: -0.03 to 0.05). Latent mean analyses for numeracy II yielded broadly comparable patterns, providing additional support for the observed trends based on raw scores.
Regression Analyses
We conducted precision-weighted hierarchical regression analyses to examine associations between survey year and cognitive functioning across all domains. These analyses were performed both for the full analytic sample and separately for each country. In all models, survey year was entered as the primary predictor in the first step, followed by participant age and education as additional predictors in subsequent steps (Table 6; detailed country level results are presented in the Supplementary Materials S1).
For the full analytical sample, survey year yielded statistically significant but trivial positive effects across all cognitive domains (partial eta squared range: .001 to .018; Table 6). In contrast, country level models revealed differentiated patterns depending on both cognitive domain and country (see Supplementary Materials S1). Working memory capacity showed meaningful time trends in seven countries, with small to medium effect sizes (partial eta squared range: .011 to .044). Free recall memory exhibited small positive effects in ten countries (partial eta squared range: .011 to .038) and a large effect in one country (Poland: partial eta squared = .113). For verbal fluency, small positive effects were observed in seven countries (partial eta squared range: .010 to .030), with medium effects in two countries (Czech Republic: .075; Poland: .041). Non-trivial positive time trends for numeracy I were identified in three countries (partial eta squared range: .011 to .019), and for numeracy II in one country (Hungary: .011).
In addition to survey year effects, participant age consistently exhibited negative associations with cognitive function scores across all domains. The strongest age-related declines were observed for working memory capacity (partial eta squared = 0.145) and free recall memory (partial eta squared = 0.142; Table 6). Country-level analyses yielded comparable patterns. Model fit consistently improved with the stepwise inclusion of predictors, with Step 2 explaining a significantly larger proportion of variance than step 1, and step 3 yielding further significant incremental gains over step 2.
Highest educational qualification showed consistently positive associations with cognitive functions, with effect sizes in the medium to large range (partial eta squared = .073 to .124), thus reflecting better cognitive outcomes for individuals with higher ISCED education levels. Full country specific regression results for all predictors and domains are provided in Supplementary S1.
Positive manifold changes
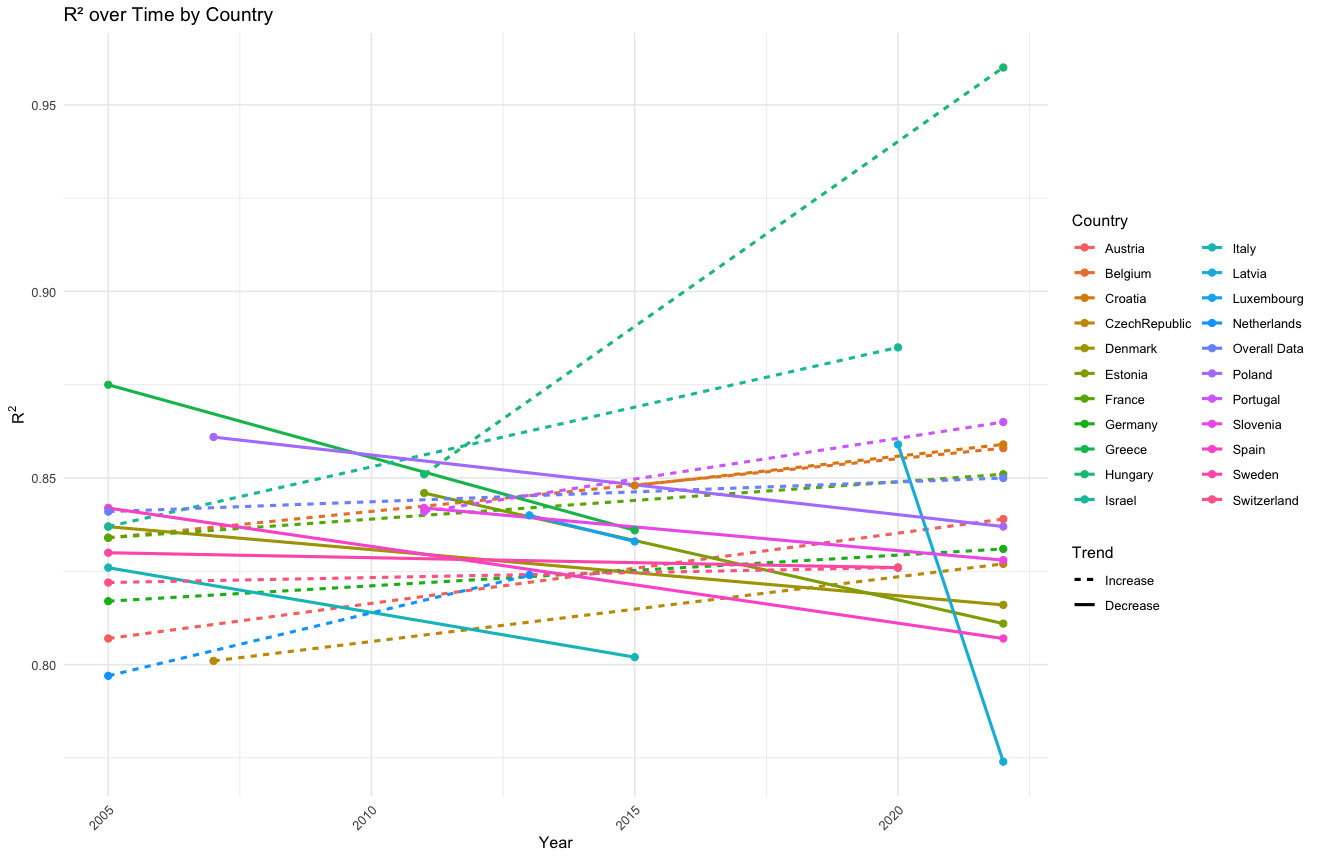
Our examination of positive manifold changes revealed inconsistent patterns across the full analytical sample, with R² values reflecting both periods of increasing and decreasing strength. However, between 2005 and 2022 positive manifold strength as measured via R2 significantly increased from .841 (95% CI [0.838; 0.844]) to .850 (95% CI [0.845; 0.855]) for the full analytical sample with substantial differentiation emerging according to country.
Notably, significant increases in the strength of the positive manifold were observed in Hungary and Israel, indicating somewhat progressively stronger intercorrelations between cognitive domains over time. Non-significant increases were observed in Austria, Belgium, Croatia, Czech Republic, France, Germany, Netherlands, Portugal, and Switzerland.
In contrast, other countries, such as Greece and Latvia, exhibited significant decreases in R² values, suggesting a weakening of the positive manifold in those regions. Non-significant decreases were observed in Denmark, Estonia, Italy, Luxembourg, Poland, Slovenia, Spain, and Sweden. All R² trajectories are displayed in 3 and country specific analyses and bivariate intercorrelation matrices can be found in Supplementary Materials. Hierarchical omega (ωₕ) estimates were broadly consistent with the R²-based trends, with most, but not all, countries displaying identical directional changes across both indices (Table 5)
Discussion
Here, we examined longitudinal trends in cognitive function and the strength of the positive manifold among older adults across 22 countries in the SHARE data between 2005 and 2022. Our findings indicate consistent positive Flynn effects across all five cognitive domains, while there were no consistent changes in cross-temporal positive manifold strength. These findings present several points of interest, as we discuss below.
Consistent with prior research on cognitive gains in adulthood (Pietschnig & Voracek, 2012) and older age (e.g., Clouston et al., 2021; Dickinson & Hiscock, 2010; Hessel et al., 2018; Zhang et al., 2024), we observed predominantly positive Flynn effects across all domains. Among these, verbal fluency exhibited the strongest and most consistent gains, whereas both numeracy domains showed comparatively smaller improvements. This pattern partially contrasts with previous literature that generally reported larger Flynn effects for fluid relative to crystallized abilities (Pietschnig & Voracek, 2012). In contrast, the verbal fluency task used here is not treated as a crystallized measure but as an indicator of executive functioning, consistent with contemporary frameworks that emphasize cognitive control and retrieval fluency (e.g. Amunts et al., 2018). However, recent work by Massa et al. (2024) also identified verbal fluency as a particularly robust and informative cognitive marker across the lifespan. It is possible that these seeming contradictions are a consequence of jingle-jangle fallacies in terms of effect classifications (Kelley, 1927) rather than representing genuine inconsistencies. Another plausible explanation for these contrasting results may be rooted in the distinct age-related trajectories of cognitive domains.
Abilities such as verbal fluency, which integrate crystallized lexical knowledge with fluid executive and speed components (retrieval, switching), may be considered to be comparatively stable in older adulthood due to preserved knowledge, whereas more abilities that are more closely related to fluid and reasoning abilities typically decline with aging-related neurobiological changes, particularly in frontal brain regions (Dickinson & Hiscock, 2010; Harada et al., 2013; Salthouse, 2015).In addition to these age-related mechanisms, cohort-linked environmental influences may have also contributed to domain-specific trends. Cohort differences observed here likely also reflect cumulative environmental advantages experienced by later-born cohorts echoing evidence that early-life conditions and societal improvements can produce lifelong resilience in cognitive functioning. For example, increasing societal and educational emphasis on communication and language-based skills may have reinforced verbal fluency performance relative to numeracy domains, which is consistent with evidence of environmentally driven gains in verbal abilities (Flynn, 2012; Greenfield, 2009; Rönnlund & Nilsson, 2008).
Our analyses also revealed small to moderate gains in memory-related domains, specifically working memory and free recall which involve core executive function processes. These findings support prior observations of increases in verbal and visiospatial working memory (Baxendale, 2010; Wongupparaj et al., 2017) but contrast indications of stagnation or decline (Gignac, 2015; Graves et al., 2021; Lazaridis, 2022). Such inconsistencies across studies may be conceivably attributable to cohort-specific historical and environmental exposures that shape cognitive reserve and health differently across generations. For example, older cohorts often had limited access to formal education, physically demanding occupations, and less comprehensive healthcare systems, all of which are associated with lower baseline cognitive performance and accelerated decline in later life (e.g. Sauerberg, 2021; Van Der Noordt et al., 2019). In contrast, more recent cohorts have typically benefited from extended schooling, cognitively stimulating work environments, and improved preventive and medical care, which are known to enhance cognitive reserve and mitigate age-related decline (e.g. Montemurro et al., 2025). These structural differences likely contribute to differentiated cognitive aging trajectories observed across studies. Given the established vulnerability of memory functions to age-related decline (Murman, 2015), the positive trends observed here suggest that protective influences have operated within more recent cohorts. Conceivably, these gains may reflect the emergence of cognitively healthier cohorts, consistent with evidence of long-run improvements in health and functional capacity in older European populations (Börsch-Supan et al., 2021). Cohort-related improvements in morbidity profiles, cardiovascular health, and everyday functioning have been identified as major contributors to cognitive advantages in later-born aging cohorts (e.g., Clouston et al., 2021; Zheng, 2021; Zhang et al., 2024). These mechanisms are characteristic for aging samples and differ fundamentally from conventional Flynn effect research.
In line with our broader findings, most countries exhibited small-to-moderate gains in both numeracy I and II. These domains primarily reflect fluid cognitive processes, such as quantitative reasoning and applied problem solving, which are generally considered vulnerable to neurocognitive aging and rely substantially on executive functioning components. The presence of positive Flynn effects in these fluid domains is therefore notable, particularly among older adults. Previous meta-analytic research has consistently demonstrated that gains in fluid abilities, including numerical reasoning, have occurred across various age groups (Pietschnig & Voracek, 2012).
Several factors may contribute to the observed trends across all domains. First, rising levels of formal education and greater participation in lifelong learning activities may have differentially preserved cognitive abilities. According to the cognitive reserve hypothesis (Stern, 2009; Whalley et al., 2004), sustained intellectual engagement fosters more efficient neural networks, particularly benefiting higher order cognitive functions such as working memory and verbal abilities. Higher levels of formal education are also associated with increased participation in lifelong learning activities (Nermond, 2024), which may further reinforce domain-specific gains, particularly in verbal abilities. However, while the comparatively larger improvements in verbal fluency may plausibly reflect the cumulative effects of educational and post-educational engagement, it is notable that these gains remain robust even when controlling for education, but are attenuated when adjusting for age (see Table 6). This pattern implies that factors beyond formal education (e.g., lifelong cognitive stimulation) contribute to cohort differences. Nonetheless, these verbal domain changes should be interpreted cautiously, given the potential influences of measurement non-invariance that could not be assessed in the present study due to the scale response format. However, these potential biases may be assumed to be limited due to the task’s simplicity (i.e., mere production of words) that can be considered to be largely impervious to non-invariance. Of note, while verbal fluency is often considered a higher-order ability, its operationalization in the SHARE study may overlap with elementary retrieval processes, thereby limiting the specificity of inferences about educational effects.
Second, the increasingly complex cognitive demands of everyday life particularly through widespread engagement with digital technology may have contributed to cognitive maintenance and gains in older adulthood. The technological reserve hypothesis (Stern et al., 2023) posits that frequent interaction with digital devices, online platforms, and cognitively stimulating applications may enhance cognitive functioning through ongoing mental engagement and compensatory mechanisms (Benge & Scullin, 2025; Bordone et al., 2015; Charness & Schaie, 2010). However, substantial variation exists in the degree of technological engagement among older adults across European countries. Differences in economic resources, digital literacy, and cohort-specific attitudes toward technology adoption may moderate these effects and partly explain the observed cross-country variability in cognitive trends. Empirical evidence supports this view: older adults’ internet use and digital competence are differentiated according to education, income, and national digital infrastructure (Cruz-Jesus et al., 2012; Rasi-Heikkinen & Doh, 2023; Seifert et al., 2021).
Positive manifold changes
Our analyses of positive manifold trends did not yield any clearly discernible pattern across cohorts, thus contrasting the idea of changes in the positive manifold strength as a potential cause for Flynn effect reversals that have been observed in other studies. While the full analytic sample indicated a statistically significant overall increase in positive manifold strength between the earliest and latest assessment periods, our results suggest that these changes were neither gradual nor uniform. Instead, shifts in g-saturation appeared erratic between waves, both across and within countries (see Figure 3), complicating attempts to infer meaningful temporal structure. While previous research has reported temporally non-linear cognitive trends shaped by contextual factors such as education, economic conditions, or population health (Dutton et al., 2016; Flynn, 2012; Pietschnig & Voracek, 2015; Sundet et al., 2004), the present results do not point to a consistent pattern in the strength of intercorrelations. We note that in contrast to typical Flynn effect studies, aging populations are simultaneously affected by age-related decline, survivorship and attrition dynamics, and cohort-linked health differences (e.g. Salthouse, 2016; Zhang et al., 2021), thus possibly obscuring positive manifold change patterns.
Positive manifold trajectories also varied substantially across countries, suggesting the influence of country-specific contextual factors. For example, Italy showed a decline in positive manifold strength during the observed period, a finding broadly consistent with earlier reports of downward trends in Italian highschool student samples (Pietschnig et al., 2023). In contrast, Austria exhibited an increase in positive manifold strength across the observation period in our present data, despite earlier reports indicating declines based on cognitive test standardization data form younger Austrian cohorts (Andrzejewski, Zeilinger, et al., 2024; Oberleiter et al., 2024). The inconsistent patterns observed across countries and time points provide preliminary indications that Flynn effects related to executive functions may operate for the most part independently from trends in psychometric g.
It is important to note that most prior cross-temporal investigations of the positive manifold have focused on assessing standard cognitive ability domains. By contrast, the cognitive assessments used in the SHARE dataset primarily target executive functions rather than the broader range of cognitive abilities typically measured in psychometric ability tests. This distinction may limit the comparability with other examinations of positive manifold changes, because the presently used proxy for g is based on a comparatively narrow number of executive functioning domains.
Executive functions refer to higher-order cognitive processes involved in regulating goal-directed behavior, including working memory, inhibitory control, cognitive flexibility, and planning (Diamond, 2013; Miyake & Friedman, 2012). In contrast, traditional cognitive abilities as measured in psychometric intelligence tests encompass standard cognitive ability domains such as reasoning, spatial visualization, verbal comprehension, or abstract problem solving (Carroll, 1993; Jensen, 1998). Whilst cognitive functioning and other more standard cognitive ability measures are correlated, the intercorrelations between the presently rather narrow set of variables may not necessarily be expected to yield identical patterns compared to more salient operationalizations of the positive manifold of intelligence.
Limitations
In the present analyses, we applied a forced single factor extraction to estimate the positive manifold, modeling shared variance across the available cognitive tasks. However, the interpretation of this extracted general factor critically depends on the breadth and content of the cognitive indicators included (Johnson et al., 2004, 2008). Psychometric g, as traditionally conceptualized, is derived from a broad range of higher order cognitive abilities, whereas the present g factor likely reflects an executive function-specific construct given the domain composition of the SHARE battery (Johnson et al., 2008). Consequently, our results reflect longitudinal trends in executive functions rather than general intelligence per se.
Second, measurement invariance analyses could only be performed for one of the five cognitive tasks (numeracy II, see Table 7), due to subscale measurement properties. This raises concerns about the meaningfulness of the observed test score changes in the remaining four domains and in particular when it comes to verbal fluency. However, the non-verbal subscales of our cognitive functioning assessments should be largely unaffected from measurement non-invariance-related problems.
Third, some of the decadal IQ (DIQ) estimates derived in this study appear implausibly large and warrant careful interpretation. Because DIQs are standardized based on the length of time intervals between samples, even modest performance differences may yield disproportionately large DIQ values when intervals are brief. Thus, high DIQ estimates may exaggerate the magnitude of true cognitive changes, reflecting short-term interval sensitivity rather than substantial cognitive gains or losses. However, changes were for the most part remarkably consistent in terms of sign across countries, thus indicating meaningful evidence for predominantly positive cognitive functioning Flynn effects in our data.
Finally, due to our analytical approach, our results rely on refreshment samples added across SHARE waves. However, refreshment sampling was not consistently implemented across all countries or waves, introducing temporal gaps in the available data. For example, Greece, Italy, and Luxembourg provided no new samples after 2015, restricting temporal continuity, while Finland and Latvia joined SHARE only in 2017, thereby limiting the observation period for these countries. Moreover, in the interpretation of cohort differences in older-adult samples methodological challenges specific to aging research have to be accounted for. In contrast to studies of younger populations, cognitive data from older adults are shaped by demographic processes such as age-related decline and selective survival. These factors affect who remains available for testing in later life. Although the current design compares cohorts at virtually identical ages and does not estimate within-person change, these background processes may conceivably influence the sampled populations. As a result, they may subtly affect observed differences. Previous studies have emphasized the importance of these demographic influences when analyzing secular trends in aging populations (e.g., Clouston et al., 2021; Rodgers, 2023). The present findings should be interpreted with these considerations in mind.
Final words
Taken together, our findings provide robust evidence for positive Flynn effects in executive functioning in older European adults that are differentiated in strength according to country and domain. While verbal and working memory functions exhibited the most consistent improvements, effects for numeracy were less unequivocal. In all, no consistent systematic changes in the strength of the positive manifold emerged, thus indicating that the presently observed Flynn effect operates independently of psychometric g.
Credit Statement
Conceptualization: D.A. and J.P.; methodology: D.A. and J.P.; software: D.A.; validation: J.F. and J.P.; formal analysis: D.A.; investigation: D.A.; data curation: D.A. and J.F.; writing original draft preparation: D.A.; writing—review and editing: J.F. and J.P.; visualization: J.F. and D.A.; supervision: J.P.; project administration: D.A."