1. The relevance of a general factor and a reading-specific factor
The Programme for International Student Assessment (PISA) “assesses the extent to which students near the end of compulsory education have acquired some of the knowledge and skills that are essential for full participation in modern societies, with a focus on reading, mathematics and science” (OECD, 2010d, p. 18). In previous PISA studies, strong latent correlations have been identified between the mathematics, science, and reading literacy scales (e.g., .81 ≤ rlatent ≤ .90 in PISA 2015; OECD, 2017, p. 247) as well as between the reading subscales (e.g., .88 ≤ rlatent ≤ .94 in PISA 2000; Artelt & Schlagmüller, 2004, p. 174, German data set). A multitude of factors may influence the correlations between the PISA domains (reading, mathematics, and science) or their subdomains (i.e., subscales). These include, for instance, the similarity of cognitive demands across PISA items (Rindermann & Baumeister, 2015), substantial variability in student competences (Prenzel et al., 2001), and test-taking behavior such as test motivation or guessing (Borger et al., 2025; He et al., 2025; Michaelides et al., 2024). Additionally, the use of latent rather than manifest correlations is a contributing factor (OECD, 2012). “Latent correlations [rlatent] are unbiased estimates of the true correlation between the underlying latent variables. As such they are not attenuated by the unreliability of the measures and will generally be higher than the typical product moment correlations [rmanifest] that have not been disattenuated for unreliability” (OECD, 2012, p. 194). For instance, rlatent is .12 to .24 units greater than rmanifest for correlations between reading literacy subscales and between competence domains (reading, mathematics, science) on total scale level, based on German PISA 2000 data (see Artelt & Schlagmüller, 2004, pp. 171, 174).
Past nested-factor model analyses have shown that individual differences in and correlations between the total scales, subscales, and items of the three dimensions—reading, mathematics, and science—can be attributed to a general factor (g) (e.g., Brunner, 2008; Brunner et al., 2013; Pokropek, Marks, & Borgonovi, 2022; Pokropek, Marks, Borgonovi, et al., 2022). Moreover, previous research has indicated that nested-factor models provide superior model fit compared with one-factor models. In nested-factor models, one or more independent competence-specific factors (e.g., reading, mathematics, or science) are postulated in conjunction with a general factor. The general factor (g) is variously referred to as, for example, reasoning ability (Brunner, 2008), general student achievement (Brunner et al., 2013), intelligence (Rindermann, 2007), general cognitive abilities (Kampa et al., 2021), or general academic ability (Pokropek, Marks, Borgonovi, et al., 2022). The designation of this factor as reasoning ability or intelligence can be supported by the following research results:
-
PISA items include, to some extent, cognitive demands relevant to intelligence, such as comprehension, reasoning, and problem-solving (Baumert et al., 2009; Rindermann & Baumeister, 2015).
-
Significant, positive, and moderate to strong latent or manifest correlations have been reported between the PISA competences (i.e., reading, mathematics, and science) and intelligence test results, as well as between the latter and reading or mathematics sub-competences, based on German, Polish, and Latin American PISA data (e.g., .42 < ≤ .86; see Brunner, 2008; Flores-Mendoza et al., 2021; Kampa et al., 2021; Knoche & Lind, 2004; Kriegbaum & Spinath, 2016; Leutner et al., 2005, 2006; Pokropek, Marks, & Borgonovi, 2022; Rajchert et al., 2014; Wirth et al., 2005).
-
Substantial to high loadings (λ) have been observed for intelligence test items from Raven’s Standard Progressive Matrices (Jaworowska et al., 2000) and for the PISA 2009 reading, mathematics, and science items on a general factor (e.g., .08 ≤ λ ≤ .81, mean λ = .50; see Pokropek, Marks, & Borgonovi, 2022) as well as for the intelligence subtests word and figure analogies from the Cognitive Ability Test (Heller & Perleth, 2000) and the PISA 2000 mathematics and reading literacy subscales (e.g., .48 ≤ λ ≤ .75; see Brunner, 2008).
-
A similar pattern of correlations has been identified for the general factor (g) and intelligence with various student characteristics (e.g., reading enjoyment, number of books at home; see Brunner, 2006, 2008; Pokropek, Marks, & Borgonovi, 2022). However, the research conducted by Pokropek, Marks, and Borgonovi (2022) concerning gender and weekly learning time in the humanities subject area exhibited inconsistencies.
The correlational relationships between g and parental education or delayed schooling as intelligence-relevant variables (e.g., Rindermann, 2018) have yet to be examined.
An assumed reading-specific factor is one that exclusively refers to the domain of reading literacy. Therefore, it should correlate closely with reading-related student characteristics (Pokropek, Marks, & Borgonovi, 2022). In previous analyses, correlations were identified between a reading-specific factor and several reading-related student variables, including reading enjoyment, verbal self-concept, and German grade (e.g., Brunner, 2006, 2008; Pokropek, Marks, & Borgonovi, 2022). However, the precise nature of this factor has remained unclear, given the weak to moderate strength of these correlations. Nevertheless, its correlations with the use of memorization, elaboration, and control strategies, as well as with students’ ability to accurately assess the usefulness of effective strategies for dealing with textual information, have not yet been investigated. These strategies, especially those dealing with text, may be regarded as reading-specific student characteristics, as they are designed to facilitate the learning and comprehension of texts (OECD, 2010c).
The objective of this study is to provide a more comprehensive description of the general PISA factor (i.e., PISA-g) and the reading-specific factor. To this end, a correlation analysis will be conducted between these factors and intelligence-related and reading-specific student characteristics, respectively. The PISA 2009 data set is particularly well suited to this purpose because it includes reading-related variables such as memorization, elaboration, and control strategies—variables that are not available in more recent PISA cycles, including PISA 2018 and 2022.
2. Research questions and analytical approach
The following research questions will guide our study:
-
Are there similarities in terms of task content and cognitive demands among the reading literacy subscales and the mathematics and science competence total scales?
-
How strong are the latent correlations among these competences and subscales?
-
To what extent can these latent correlations be attributed to a general factor (PISA-g) or to a factor specific to reading?
-
What do a general factor and a reading-specific factor represent?
In order to address the aforementioned research questions, the subsequent analytical approach was employed: The theoretical conception of the three competences—reading, mathematics, and science—is presented herein, along with a description of exemplary item demands. Subsequently, comparisons will be made between these competences (reading: subscales) with respect to possible similar task requirements. In order to theoretically derive and describe a general factor explaining the correlations between the competences and sub-competences in PISA 2009, the demands of the PISA items are compared with two comprehensive definitions of intelligence: one by Gottfredson (1997a, 1997b) and the other by Rindermann (2018) as well as with the demands of an intelligence test used in the Polish national extension of PISA 2009 (Pokropek, Marks, & Borgonovi, 2022). Next, a nested-factor model and a one-factor model, based on the reading competence subscales, mathematics competence, and science competence, are computed. The model fit of each will be compared to determine the most appropriate factor model for subsequent analyses. In order to develop or refine a conceptualization of PISA-g and a reading-specific factor, their correlational relationships with student characteristics relevant to intelligence or specific to reading are examined. Consequently, an examination is conducted to ascertain the reading specificity of the student characteristics associated with reading.
3. Item demands and examples of their similarities across different domains in PISA 2009
3.1. Exemplary (item) requirements and similarities among reading literacy subscales
“Accessing and retrieving involves going to the information space provided and navigating in that space to locate and retrieve one or more distinct pieces of information” (OECD, 2010b, p. 35). For the items related to access and retrieval, the information provided must be recognized in the question. This information is matched, either literally or synonymously, with the other information provided, for example, in a text, table, chart, graph, timetable, or a combination thereof (OECD, 2010b). In addition, the information must be compared with information already available in memory. When searching for synonymous content, mental categorization processes may be employed to identify the information being requested (OECD, 2010d). For example, in Question 3 regarding Balloon, students were asked the following: “Vijaypat Singhania used technologies found in two other types of transport. Which types of transport?” (OECD, 2010d, p. 99). However, the term “transport” was not explicitly present in the corresponding figure, but rather the statements “Aluminium construction, like airplanes” (OECD, 2010d, p. 99) and “Vijaypat Singhania wore a space suit during the trip” (OECD, 2010d, p. 99). Therefore, students had to recognize that these two statements implicitly referred to two types of transportation (OECD, 2010d). The information sought may not be explicitly included in the text; rather, it must be inferred (Artelt et al., 2001). The extent of necessary inferences depends on the explicitness of the (semantic) correspondence between the given pieces of information in the question and those provided in the text (Adams & Wu, 2003). Accessing and retrieving primarily requires understanding at the sentence level (OECD, 2019). However, depending on the difficulty of the Access and Retrieve items, understanding larger parts of the text may be necessary (Artelt et al., 2001). According to Schnotz and Dutke (2004), coherence formation is a mental process that enables the comprehension of consecutive sentences. For specific Access and Retrieve items (e.g., Questions 2 and 3 on Brushing Your Teeth in Table B1 in Appendix B; OECD, 2010d, p. 92), local coherence formation may therefore be necessary (Baumert et al., 2009; Schnotz & Dutke, 2004). Generating semantic connections between sentences or larger text parts involves drawing conclusions (reasoning) and using knowledge of various kinds (Baumert et al., 2009). The same applies to Access and Retrieve items that require the comprehension of depictive representations (Schnotz, 2014; Schnotz & Dutke, 2004), such as diagrams and graphs (OECD, 2010b, 2012). More difficult access and retrieval tasks may require the use of “knowledge of text structures and features” (OECD, 2010d, p. 59).
“Integrating and interpreting involves processing what is read to make internal sense of a text. … Integrating focuses on demonstrating an understanding of the coherence of the text. It can range from recognising local coherence between a couple of adjacent sentences, to understanding the relationship between several paragraphs, to recognising connections across multiple texts” (OECD, 2010b, p. 36). These relationships include “problem-solution, cause-effect, category-example, equivalency, compare-contrast, and understanding whole-part relationships” (OECD, 2010d, p. 61). For example, comparing means finding similarities between information, while contrasting focuses on identifying the differences between them (OECD, 1999b). Interpreting refers to “the process of making meaning from something that is not stated” (OECD, 2010d, p. 61). For example, it involves recognizing a not explicitly mentioned relationship or deducing (inferring) “the connotation of a phrase or a sentence” (OECD, 2010d, p. 61). Items in the Integrate and Interpret subscale may require a range of cognitive processes, including: identifying similarities or differences by comparing or contrasting information; drawing conclusions or making inferences; and understanding texts, diagrams, tables, graphs, or their components (Baumert et al., 2009; OECD, 2010b, 2010d; Schnotz & Dutke, 2004). They may also involve abstract thinking, such as engaging with abstract texts (OECD, 2010b) or generating abstract categories for interpretation (see proficiency level 6 of Integrate and Interpret, OECD, 2010d, p. 63) as well as generalizing subtle nuances in language (OECD, 2010b).
“Reflecting and evaluating involves drawing upon knowledge, ideas or attitudes beyond the text in order to relate the information provided within the text to one’s own conceptual and experiential frames of reference” (OECD, 2010b, p. 37). Reflecting focuses on drawing upon one’s own experiences or knowledge in order to make comparisons, contrasts, or hypotheses (OECD, 2010b). Evaluating is the formation of a judgment based on formal or substantive knowledge of the world or on personal experience (OECD, 2010d). The more extensive and in-depth the assumed understanding of a text must be for reflection and evaluation, the more cognitively demanding the task becomes (Adams & Wu, 2003). As the Reflect and Evaluate items can also refer to diagrams, graphs, tables, and other representations (OECD, 2010b, 2012), understanding them may be necessary to solve the corresponding items. This involves the coherence formation process associated with reasoning such as drawing inferences and conclusions, and applying different types of knowledge (Baumert et al., 2009; Schnotz & Dutke, 2004). In order to reflect on and evaluate the form of a text, it is relevant to have “knowledge of text structure, the style typical of different kinds of texts and register” (OECD, 2010d, p. 67).
According to the PISA 2009 Assessment Framework, the reading competence subscales are considered to be interdependent: Retrieval serves as a prerequisite for the interpretation and integration of information, and interpretation, in turn, is required for subsequent reflection and evaluation (OECD, 2010b). This implies that a reading item may also necessitate characteristics of another subscale (see Table B1). Thus, it measures this subscale to a certain extent as well. For example, in Question 3 of The Play’s The Thing (see Table B1), students were asked, “What were the characters in the play doing just before the curtain went up?” (OECD, 2010d, p. 108). In order to answer this question, it is first necessary to locate the relevant passage of text. Subsequently, integration and interpretation can be applied to arrive at the correct response (OECD, 2010d).
Certain Access and Retrieve items may also require elements of Integration and Interpretation, particularly when establishing semantic coherence between two adjacent sentences is necessary to identify the relevant information (see Table B1: Questions 2 and 3 regarding Brushing Your Teeth; OECD, 2010d, p. 92). Furthermore, specific Reflect and Evaluate items may be solved by accessing and retrieving information or by integrating and interpreting it. For example, in Question 4 concerning Brushing Your Teeth (see Table B1), the following was asked: “Why is a pen mentioned in the text?” (OECD, 2010d, p. 92). The answer to this question could be found by accessing and retrieving the relevant information in the given text (OECD, 2010d). In Question 4 regarding Balloon, it was asked “What is the purpose of including a drawing of a jumbo jet in this text?” (OECD, 2010d, p. 100). The jumbo jet was utilized as a reference point for the determination of the achieved height of the balloon (OECD, 2010d). To identify the intended purpose, it was also possible to integrate and interpret the non-continuous text information by means of an altitude comparison between the jumbo jet and the balloon.
Comparisons and abstract thinking may be required by Integrate and Interpret items as well as by Reflect and Evaluate items. Abstract thinking, in terms of categorizing information, and comparisons also play a role in the Access and Retrieve items when the given task information must be compared semantically with the information provided in the text (e.g., Question 3 regarding Balloon). Furthermore, the ability to draw conclusions and inferences (reasoning), as well as the comprehension—to various degrees—of the text, its parts, and other representations (e.g., diagrams, graphs, and tables), are necessary for reading items from different reading competence subscales. In summary, the description of the reading literacy subscales, their conceptual interdependence, and sample reading items (e.g., OECD, 2010d, pp. 91–111) imply partly similar demands (e.g., reasoning, abstract thinking, comparing, and understanding) across reading items from different reading literacy subscales. This may favor correlations between these subscales in PISA 2009.
3.2. Mathematics and science literacy requirements and exemplary commonalities with reading literacy subscales
In PISA 2009, the mathematical competence (mathematical literacy) was defined as “the capacity of an individual to formulate, employ and interpret mathematics in a variety of contexts. It includes reasoning mathematically and using mathematical concepts, procedures, facts and tools to describe, explain and predict phenomena” (OECD, 2010d, p. 23). By successfully participating in the mathematization process of a problem, students must retrieve and/or apply knowledge from different mathematical content areas (i.e., Space and Shape, Change and Relationship, Quantity, and Uncertainty). In addition, the following eight postulated mathematical abilities are employed: mathematical thinking and reasoning; argumentation; communication; modeling; problem posing and solving; representation; the use of symbolic, formal, and technical language and operations; and the use of aids and tools (see Table B2 in Appendix B). The PISA mathematics tasks were designed to engage one or more of those mathematical abilities (OECD, 2004). However, they were not assessed separately as subscales but were instead regarded collectively as constituting the PISA mathematical competence (OECD, 2010b). The PISA 2009 mathematics items require, for instance, working with and understanding different representations of mathematical situations and objects (e.g., text, diagrams, graphs, charts, tables, and algebraic representations; OECD, 2010a); problem solving (OECD, 2010b); drawing conclusions and inferences (i.e., reasoning; Baumert et al., 2009; see also Jakubowski, 2013); insight and generalization (OECD, 2010b), spatial reasoning (e.g., Jakubowski, 2013; see Space and Shape in OECD, 2010b); planning and implementing solution strategies (see the Reflection cluster in OECD, 2010b); and recalling and applying knowledge from different mathematical content areas (OECD, 2010b).
In PISA 2009, the science competence (scientific literacy) referred to "the extent to which an individual possesses scientific knowledge and uses that knowledge to identify questions, acquire new knowledge, explain scientific phenomena and draw evidence-based conclusions about science-related issues; … " (OECD, 2010d, p. 23). The PISA 2009 science items were taken from the PISA 2006 science literacy subscales Identifying Scientific Issues, Explaining Scientific Phenomena, and Using Scientific Evidence (OECD, 2009a, 2012). A depiction of the key characteristics of these subscales can be found in Table B3 in Appendix B. The PISA 2009 science items may necessitate, for example, recalling and applying knowledge about science (i.e., scientific inquiry and explanations) and of science (i.e., physical, living, technological, and earth/space systems); inductive reasoning (i.e., “reasoning from detailed facts to general principles”, OECD, 2010b, p. 137) and deductive reasoning (i.e., “reasoning from the general to the particular”, OECD, 2010b, p. 137); integrated and critical thinking; transforming representations (e.g., “data to table, tables to graphs”, OECD, 2010b, p. 137); generating and communicating data-based explanations and arguments; applying mathematical skills, knowledge, and processes; generalization and gaining insight to form conclusions, judgments, and explanations; abstract thinking (e.g., for working with abstract concepts, models, and ideas; OECD, 2010b, 2010d); and comprehending texts, graphs, diagrams, tables, photographs, or combinations thereof (OECD, 2010b; Schnotz & Dutke, 2004).
A comparison of item requirements across domains has yielded the following exemplary similarities:
Reading-related reflecting and evaluating may play a role in certain mathematical and science items if, for instance, evaluating evidence (e.g., data) or conclusions, or drawing primarily on prior knowledge for giving explanations and arguments is required (see levels 4–6 of Using Scientific Evidence, and levels 1–6 of Explaining Phenomena Scientifically, OECD, 2009a; see mathematical abilities of argumentation and modeling; OECD, 2010a; see proficiency level 5 of Quantity, levels 4–6 of Space and Shape, levels 5–6 of Relationships and Change, and level 5 of Uncertainty; OECD, 2005).
The reading-related accessing and retrieving, as well as integrating and interpreting, may be relevant for specific mathematical and science items. These two can be applied to these items for identifying solution-related information that is included explicitly or implicitly in the given information material. For example, certain mathematics and science items involve locating and retrieving (i.e., extracting) relevant information from various representations, such as texts, graphs, tables, or diagrams (see level 2 of Change and Relationships, levels 2–3 and 5 of Quantity, and level 5 of Uncertainty; OECD, 2005; see levels 1 and 3–4 of Using Scientific Evidence; OECD, 2009a). With regard to the integration and interpretation of information, specific mathematical items necessitate the comprehension and interpretation of text for the formulation of a mathematical model (see proficiency level 4 of Quantity in OECD, 2005); for the solution of a geometrical problem (see level 4 of Space and Shape; OECD, 2005); or for the calculation of probabilities (see levels 4–5 of Uncertainty; OECD, 2005). Furthermore, for specific mathematics items, it is also necessary to understand or interpret diagrams, tables, graphs, and other representations (see levels 1–3 and 5 of Quantity, levels 3–4 of Change and Relationships, and levels 3 and 5 of Uncertainty; OECD, 2005; see also Jakubowski, 2013; see mathematical abilities representation and communication in OECD, 2010a).
Certain science items may also require reading-related integration and interpretation to identify relationships (e.g., cause–effect relationships) and for recognizing the manipulated variable or the change (see levels 1 and 3 of Explaining Phenomena Scientifically, and levels 1–5 of Identifying Scientific Issues in OECD, 2009a). Moreover, understanding and interpreting diagrams, tables, or graphs is necessary for specific science items. These items, for instance, demand data-based explanations or arguments, comparing bar heights in a diagram or columns of a table, or identifying trends (i.e., patterns) in data sets (see levels 1–5 of Explaining Scientific Phenomena; OECD, 2009a). For this purpose, comparing numbers, understanding them, recognizing numerical patterns from the mathematical content area Quantity (OECD, 2010b) may be necessary. Thus, a certain degree of mathematical competence is essential for such science items. This requirement similarly applies to specific reading items that involve interpreting numbers in diagrams, tables, or graphs.
In summary, the reading, mathematics, and science items refer to different representations of information, such as texts, diagrams, graphs, and tables, in partly similar ways. In this regard, the mathematics and science items presuppose a certain degree of reading literacy, as it encompasses understanding, reflecting on, engaging with, and using such representations (OECD, 2010b). The PISA 2009 reading, mathematics, and science items may impose some similar demands, such as reasoning (e.g., drawing conclusions and inferences); identifying similarities and differences between information by comparing or contrasting; working with and understanding different representations (e.g., text, diagrams, tables, and graphs); and abstract thinking. Insight and generalization are also required for certain mathematics and science items. Consequently, these overlapping requirements may contribute to higher correlations between the reading literacy subscales, mathematical literacy, and science literacy.
4. Derivation of a general factor and a reading-specific factor, and their relationships with student characteristics
4.1. Intelligence-related item demands and the derivation of the factors
The PISA item demands, as delineated in Sections 3.1 and 3.2, can be compared with the definitions of intelligence to identify differences and similarities. Gottfredson (1997a, 1997b) described the construct of intelligence as follows:
“Intelligence is a very general mental capability that … involves the ability to reason, plan, solve problems, think abstractly, comprehend complex ideas, learn quickly and learn from experience. It is not merely book learning, a narrow academic skill, or test-taking smarts. Rather, it reflects a broader and deeper capability for comprehending our surroundings—‘catching on,’ ‘making sense’ of things, or ‘figuring out’ what to do” (Gottfredson, 1997a, p. 13). “These sorts of mental processes—contrasting, abstracting, inferring, finding salient similarities and differences—are the building blocks of intelligence as manifested in reasoning, problem solving, and grasping new concepts with facility” (Gottfredson, 1997b, p. 96).
Rindermann (2018, p. 43) provided a comprehensive definition of intelligence, offering detailed descriptions of core components (i.e., problem solving, reasoning, abstract thinking, and understanding) mentioned by Gottfredson (1997a, 1997b) as well as additional characteristics such as “…the ability to change cognitive perspectives, to make plans and use foresight” (see Appendix A1). However, the definition of intelligence is not uniform in the literature (Gottfredson, 1997b). Consequently, depending on the definition adopted, the overlap between the cognitive demands of PISA items and intelligence may vary.
With regard to the aforementioned definitions of intelligence, the PISA 2009 items exhibit intelligence-related requirements such as reasoning (e.g., drawing conclusions and inferences), identifying similarities and differences by comparing or contrasting, abstract thinking, understanding, problem-solving, and the planning of solution strategies (see Sections 3.1–3.2). This conclusion is further supported by the findings of Pokropek, Marks, and Borgonovi (2022). In their study, the PISA competences of Polish students were assessed using PISA 2009 items, alongside intelligence as measured by Raven’s Standard Progressive Matrices (Jaworowska et al., 2000). In this intelligence test, visual elements (i.e., abstract figures) are presented in a matrix arrangement, with one field left blank. Students must identify the underlying construction principle of the matrix and select the appropriate element to fill the empty field from several given options. Raven’s intelligence test items require non-verbal reasoning, inductive or analogical spatial thinking, visual comparisons, and abstraction or identification of rules based on similarities and differences between the graphical elements (Heller et al., 1998; H. W. Krohne & Hock, 2015; Pokropek, Marks, & Borgonovi, 2022). Substantial standardized factor loadings (e.g., λ > .50; Urban & Mayerl, 2014) of the PISA 2009 reading, science, and mathematics items, as well as of the Raven’s items, were demonstrated on a general factor (.08 ≤ λ ≤ .81, mean λ = .50; Pokropek, Marks, & Borgonovi, 2022). Thus, the correlations among these items can be partially attributed to a general cognitive factor (i.e., PISA-g). The cognitive processes relevant to intelligence (e.g., abstraction, reasoning, comprehension) involve the information contained in the PISA items and the application of the students’ available knowledge (Rindermann, 2018; see Sections 3.1–3.2). Therefore, the general cognitive factor encompasses intelligence and the intelligent use of given information and available knowledge (Rindermann, 2018).
In accordance with previous research (see Section 1), it is assumed that, for each country or federal state participating in PISA 2009, the latent correlations between the reading literacy subscales can be additionally attributed to a reading-specific factor (RspecF) within a nested-factor model. This factor should be associated with reading-specific student characteristics. In the subsequent section, the expected associations of PISA-g and RspecF with intelligence-related and reading-related student variables are described.
4.2. The relationships between factors and student characteristics related to intelligence and reading
Parents’ education may reflect their intelligence to a certain extent (Steinmayr et al., 2010), which they pass on to their children through genes (Haworth et al., 2008). In addition to genetic influences, environmental influences and the interaction of both, also play a role in favoring a correlation between parental education and children’s intelligence (Steinmayr et al., 2010). For example, educated parents may create a cognitively stimulating learning environment for their children through their educational and cultural practices that can support children’s intelligence development (Rindermann, 2018). Past studies have shown significant, positive correlative relationships between parents’ educational level and their children’s intelligence (e.g., r = .36, p < .001, Rindermann & Ceci, 2018; r = .31, p < .05, Schaffner et al., 2004; r = .42 (mother) and r = .45 (father), p < .001, Ganzach, 2014; see also Lemos et al., 2011). A higher number of books at home indicates more frequent reading by children and/or their parents (Rindermann & Ceci, 2018). Continuous reading of books may promote intelligence (Schaffner, 2009), and in turn, higher intelligence can also facilitate reading (Peng et al., 2019; Peng & Kievit, 2020). In previous studies, significant positive associations were found between the number of books and the intelligence of children or adolescents (e.g., r = .40, p < .01, Brunner, 2008; r = .32, p < .05, Schaffner et al., 2004; r = .25, p < .001, Rindermann & Ceci, 2018). If the general PISA factor (PISA-g) represents an intelligence-like construct, then, like intelligence itself, it should also show a significant positive correlational relationship with father’s or mother’s education and the number of books at home. Since these student characteristics are associated with reading-related activities and attitudes (e.g., McElvany et al., 2009), significant positive correlations between them and the reading-specific factor are expected.
School attendance supports students’ intelligence development (e.g., Ceci, 1991; Ritchie & Tucker-Drob, 2018) and knowledge acquisition (Rindermann, 2011). However, students’ educational progress—and consequently, their development of intelligence and knowledge—may be delayed by factors such as class repetition (e.g., Ehmke et al., 2008; Jimerson et al., 1997; J. A. Krohne et al., 2004), delayed school enrollment, and absenteeism from class (e.g., Ceci, 1991). As a result, students may be at different grade levels, have received varying amounts of cumulative school support, and differ in their level of intelligence. Moreover, delayed enrollment and grade repetition are consequences of lower intelligence and weaker student performance. Students who repeat grades tend to be low achievers and generally demonstrate lower intelligence than non-repeaters (e.g., = –0.32 to –0.36, based on German PISA data; see Ehmke et al., 2008, 2010). Accordingly, PISA-g—representing an intelligence-like ability—is expected to correlate negatively with delayed schooling. Furthermore, delayed schooling may also be associated with a lagged acquisition of reading-related skills, knowledge, and attitudes within the school context. Consequently, a negative correlation with the reading-specific factor is anticipated.
Reading enjoyment may foster more frequent and extensive reading, which in turn enhances text comprehension (Artelt et al., 2010; Möller & Schiefele, 2004) and, thereby, contributes to higher intelligence (Schaffner, 2009). At the same time, higher intelligence may also facilitate text comprehension and promote reading enjoyment through the perception of one’s own competence (Artelt et al., 2010). Previous studies have identified a significant and positive correlation between reading enjoyment and students’ intelligence (e.g., r = .29, p < .01, Brunner, 2008; r = .16, p ≤ .001, Pokropek, Marks, & Borgonovi, 2022). Reading enjoyment may also be associated with reading-specific abilities and knowledge (Artelt et al., 2010; Pokropek, Marks, & Borgonovi, 2022). In this context, a significant and positive correlation was observed between the students’ reading enjoyment and the reading-specific factor (e.g., r = .20, p < .01, Brunner, 2008; r = .13, p <.01, Pokropek, Marks, & Borgonovi, 2022). A positive correlation between the factors (PISA-g and RspecF) and the enjoyment of reading is expected.
“Memorisation strategies refer to the memorisation of texts and contents in all their details and repeated reading. … Elaboration strategies refer to the transfer of new information to prior knowledge, out-of-school context and personal experiences. … Control strategies mean to formulate control questions about the purpose of a task or a text and its main concepts. It also means to self-supervise current study activities, particularly whether the reading material was understood” (OECD, 2010c, p. 48). Elaboration and control strategies are generally classified as deep learning strategies, whereas memorization is typically regarded as a surface-level approach to learning. The correlation between the use of these reading-related learning strategies (OECD, 2010c) and both PISA-g and RspecF will be examined.
It is not possible to draw conclusions about the appropriateness of the chosen learning strategy or the quality of its execution based on reports of its use (Artelt et al., 2010). This limitation was one of the reasons why PISA 2009 assessed students’ knowledge about appropriate strategies for understanding and learning from texts (Artelt et al., 2010). For this purpose, students’ awareness (i.e., the correct assessment of the usefulness) of effective strategies for understanding and remembering text information, as well as for summarizing it, were taken into account (Artelt et al., 2010; OECD, 2010c). The correlations between these student characteristics and the factors PISA-g and RspecF will be examined.
In summary, PISA-g and RspecF are expected to exhibit significant positive correlations with maternal and paternal education, the number of books at home, and enjoyment of reading. Moreover, significant negative correlations with delayed schooling are anticipated. In addition, significant correlations are predicted between the factors and the use of memorization, elaboration, and control strategies, as well as with students’ correct assessment of the usefulness of effective strategies for understanding and remembering text information and for summarizing it. The five aforementioned variables, in conjunction with the number of books at home and the enjoyment of reading, all of which deal with text, are considered reading-specific student characteristics. Consequently, they are expected to show significantly stronger correlations with RspecF than with PISA-g.
5. Method
5.1. Sample, test design and the competence modeling procedure
PISA’s target population comprises students who are approximately 15 years old at the time of the assessment and attend at least seventh grade or higher (OECD, 2012). For 73 of the 74 countries and federal states participating in PISA 2009, an approximately representative sample of schools, followed by students within those schools, was randomly selected from the target population. Russia employed a three-stage sampling design, with geographical areas, schools, and students constituting the first, second, and third stages, respectively (OECD, 2012). The final student sample sizes across countries and federal states ranged from 329 (Liechtenstein) to 38,250 (Mexico) (OECD, 2012). In Costa Rica, Georgia, Himachal Pradesh and Tamil Nadu (two Indian states), Malaysia, Malta, Mauritius, Miranda (a Venezuelan state), Moldova, and the United Arab Emirates, the PISA study was conducted in 2010 (Walker, 2011).
In PISA 2009, students were randomly assigned to one of 13 test booklets. All students completed a portion of the reading items. Depending on the test booklet, a subset of the mathematics and/or science items, or only the reading items, was also administered. As reading literacy was the major domain in PISA 2009, it was assessed with a sufficient number of items to allow for the estimation of not only an overall reading score but also of subscale scores (OECD, 2010b, 2012). The reading literacy subscales, as well as the overall mathematics and science scores, were estimated using a multi-step modeling procedure that took into account various factors, such as item difficulty, students’ item responses, and background information (OECD, 2012). For each student, a set of plausible values was generated for reading sub-competences, mathematical literacy, and scientific literacy. PISA uses plausible values because they yield more reliable estimates of population parameters than single test scores. To ensure unbiased estimation, it is necessary to utilize all five plausible values and the final student weight in the analyses. Plausible values (PVs) can be regarded as multiple imputations. Consequently, a statistical parameter (e.g., a mean value) must be calculated for each of the five PVs. These five parameter estimates are then averaged to provide an accurate estimate for the subpopulation or population (OECD, 2012). Furthermore, the incorporation of the 80 replication weights is imperative for obtaining precise standard error estimates (OECD, 2009b).
5.2. Measures, handling missing data, and statistical comparison of correlations
For each country and federal state, five plausible values were available for each reading competence subscale as well as for the total scales of mathematical competence and science competence per student (OECD, 2012). Parental education was measured by the number of years of schooling completed, which was estimated based on the highest reported level of the International Standard Classification of Education (ISCED; OECD, 1999a) for each parent (OECD, 2012): “[He/she] did not complete ISCED level 1” (OECD, 2012, p. 359) = 3 years; ISCED 1 (primary education) = 4 years; ISCED 2 (lower secondary) = 10 years; ISCED 3A/B/C (upper secondary/vocational or pre-vocational upper secondary) or ISCED 4 (non-tertiary post-secondary) = 13 years; ISCED 5B (vocational tertiary) = 15 years; and ISCED 5A/6 (theoretically oriented tertiary/post-graduate) = 18 years. To assess the number of books at home, respondents were given several response options (OECD, 2010b). The numerical values assigned to the categories are as follows: 1 = 0–10 books, 2 = 11–25 books, 3 = 26–100 books, 4 = 101–200 books, 5 = 201–500 books, and 6 = more than 500 books. Students’ delayed schooling was operationalized as the difference, in years, between their age and grade level. This difference may increase as a result of later enrollment and grade repetitions.
The assessment of reading enjoyment was conducted using a set of 11 items, the detailed descriptions of which can be found in Appendix A2. The students provided responses to these items using a four-point rating scale (1 = strongly disagree, 2 = disagree, 3 = agree, and 4 = strongly agree). Students’ responses to the negatively phrased items were reverse coded. Subsequently, item response theory (IRT) modeling was employed to facilitate item scaling. Consequently, weighted likelihood estimation (WLE; Warm, 1989) scores were obtained, representing students’ scores on the index of reading enjoyment. These WLE scores were standardized using the OECD mean and the corresponding standard deviation. Higher positive standardized scores are indicative of higher levels of reading enjoyment relative to the OECD mean (OECD, 2012).
The scale for the use of control strategies was generated based on five items. With respect to the scales concerning the utilization of elaboration strategies and memorization strategies, a total of four items were employed for each scale (OECD, 2012). Item descriptions can be found in Appendix A2. A four-point rating scale (1 = almost never, 2 = sometimes, 3 = often, and 4 = almost always) was provided for responses to all the items specific to the strategies mentioned above. The WLE scores of the students were obtained for each scale related to the aforementioned strategies and subsequently standardized using the respective OECD mean and standard deviation. Consequently, higher positive standardized scores on these scales indicate a more frequent use of control, elaboration, and memorization strategies compared to the corresponding OECD mean (OECD, 2012).
The scale for assessing the usefulness of effective strategies for understanding and remembering text information, as well as for writing a text summary, was developed based on students’ judgments of the usefulness of the given strategies (OECD, 2010c). For assessing the usefulness of these strategies, a six-point rating scale was employed, ranging from 1 (not useful at all) to 6 (very useful). Students’ responses were expected to align with the rank order defined by reading experts. The students’ final scores were standardized using the OECD mean and the corresponding standard deviation (OECD, 2012). Therefore, standardized scores greater than zero indicate a more accurate assessment of the usefulness of effective strategies for understanding and remembering text information (or for writing a text summary) by students compared to the OECD mean. Additional details about the specific strategies and the two corresponding scales are provided in Appendix A2.
Missing values were identified for the 74 countries and federal states, weighted in percent, for the following variables: delayed schooling (range: 0.00% to 4.00%); the number of books at home (0.08% to 12.11%); enjoyment of reading (0.44% to 9.34%); the use of memorization strategies (0.07% to 10.63%), control strategies (0.11% to 10.73%), and elaboration strategies (0.11% to 11.79%); the assessment of the usefulness of effective strategies for understanding and remembering text information (0.70% to 23.97%) and for writing a text summary (0.70% to 25.79%); and maternal education (0.23% to 18.35%) and paternal education (0.38% to 21.90%). No missing values were observed for the reading literacy subscales, mathematical literacy, and science literacy.
The factor models and correlations were estimated using the maximum likelihood estimation method. To address the issue of missing values on student characteristics, the full information maximum likelihood (FIML) estimation method was employed to calculate the correlations between factors or competences and these student characteristics. The computations were conducted using Mplus (Version 7.4; Muthén & Muthén, 2015), which also takes into account PISA’s requirements for unbiased analyses (i.e., the final student weight, replicate weights, and all plausible values; OECD, 2009b).
The statistical comparison of correlations was performed by utilizing the web front-end of Comparing Correlations (cocor; Diedenhofen & Musch, 2015), which can be accessed via http://comparingcorrelations.org. The test statistic for comparing correlations was calculated according to the method proposed by Meng et al. (1992). When the negative direction of a correlation is taken into account, a statistical comparison may, for example, result in a weaker negative or a positive correlation coefficient being tested as significantly stronger than a stronger negative correlation coefficient. However, it is important to note that the strength of a correlation is exclusively determined by the magnitude of the correlation coefficient, irrespective of its direction. Therefore, the absolute values of the correlation coefficients were employed in the statistical comparison of correlations with negative or opposite signs.
6. Results
6.1. The correlations between competences and/or subscales, and evaluating factor models
In 74 countries and federal states, moderate to very strong, positive, and significant latent correlations were shown between the reading competence subscales and the total scales of mathematical and science competence (.39 ≤ r ≤ .96, each p < .001, two-tailed test; see Table 1 for overall results and Table B4 in Appendix B for country- and state-specific results). According to Cohen (1988), |r| ≈ .10, .30, and .50 are regarded as the bottom thresholds of small, moderate, and large correlations, respectively. In these countries and federal states, nearly all latent correlations were of a relevant size, indicating favorable conditions for extracting factors in the nested-factor model and the one-factor model (i.e., r > .50; Kline, 2012). However, in Azerbaijan, the latent correlations between the total scales of mathematics and science, and between the reading subscales and mathematics, ranged from .39 to .48. These values are below .50, suggesting inadequate conditions for factor extraction.
Exploratory analyses revealed that the correlations between the reading competence subscales and the total scales of mathematical and science competence exhibited a tendency to be stronger in countries and federal states with higher gross domestic product per capita (GDPpc) and weaker in those with lower GDPpc. The relationships between these Fisher’s z-transformed correlations and the GDPpc were found to vary in strength, ranging from a weak correlation = .17, p > .05, two-tailed test) to a strong correlation = .48, p < .05; see Table B5 in Appendix B). All correlations were stronger when using the natural logarithm of GDP per capita compared with GDPpc (e.g., = .17 vs. = .33; overall mean correlation: GDPpc = .31 vs. ln(GDPpc) = .51). The relationship between GDPpc and the strength of correlations between the reading subscales, the mathematical competence, and/or the science competence is better described by a non-linear model than a linear model. In comparison with linear regression, the quadratic, cubic, and logarithmic regressions yielded higher explained variance when Fisher’s z-transformed correlations were regressed on GDPpc. However, when the natural logarithm of GDPpc was employed, the linear model was also appropriate, as it accounted for a proportion of variance similar to that of the non-linear models (see R² values in Table B5 in Appendix B).
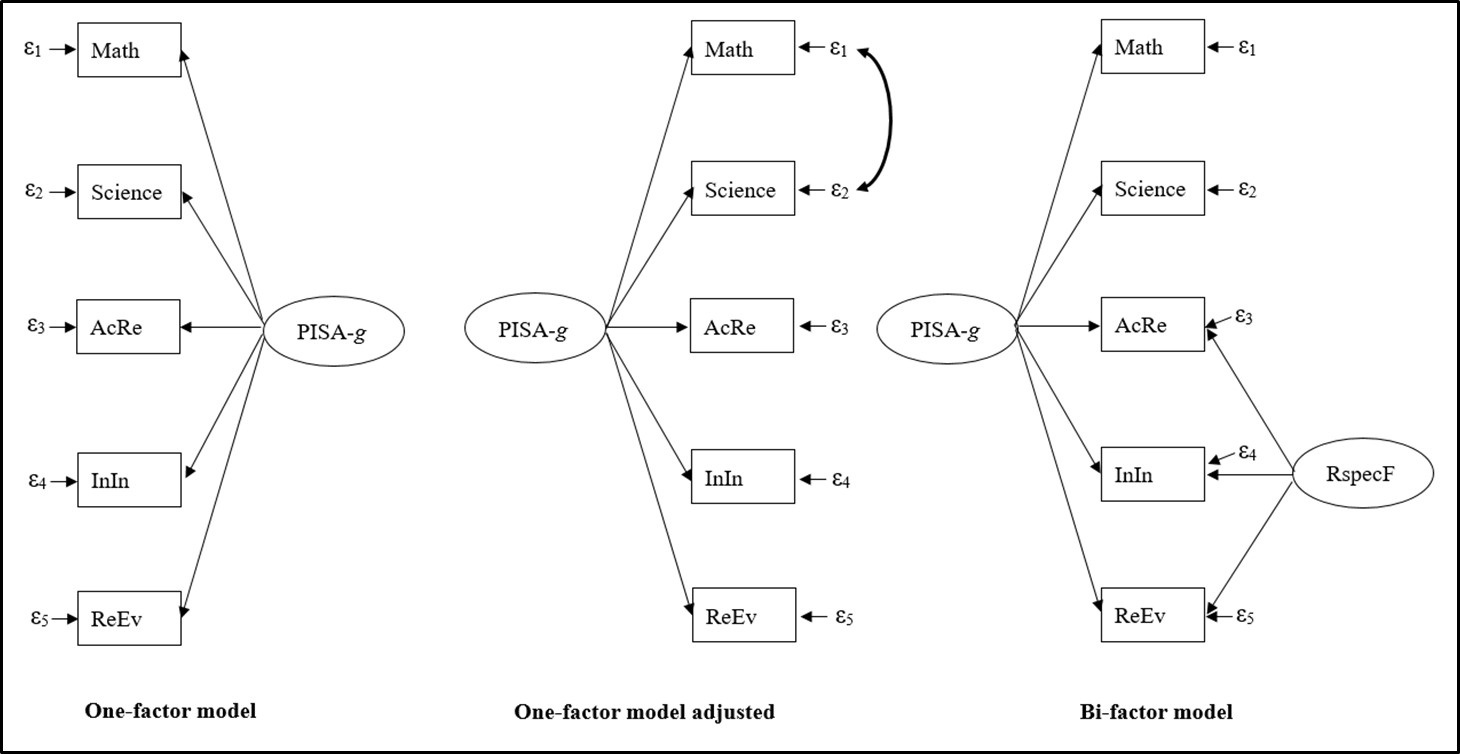
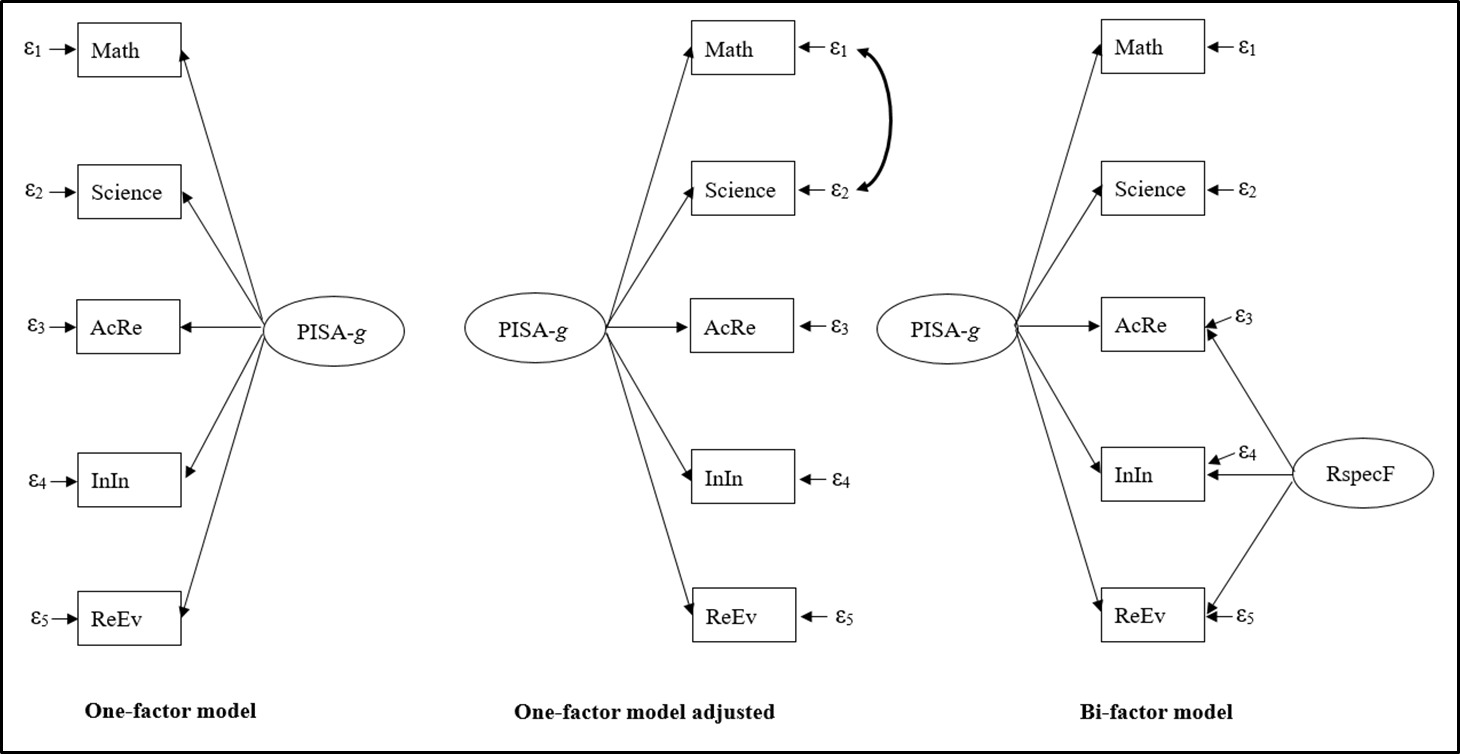
In each of the 74 countries and federal states, the single-factor model (see Figure C1 in Appendix C) exhibited a poor fit to the data, as evidenced by the root mean square error of approximation (RMSEA), which varied between .10 and .34 (see Table 2 and Table B6). This range exceeded the .05 threshold, indicating a poor fit between the model and the observed data (e.g., Urban & Mayerl, 2014). Furthermore, the lower and upper bounds of the 90% confidence intervals for the RMSEA (90% CIRMSEA) went beyond the lower limit cutoff = .05) and upper limit cutoff = .08) proposed by Urban and Mayerl (2014). The fit measures of the one-factor models improved when a correlation between the residuals of mathematical competence and science competence was additionally specified (see Table 2 and Figure C1). Consequently, the RMSEA values ranged from .00 to .11 for these factor models in the 74 countries and federal states under consideration (see RMSEA for 1F adj. in Table 2 and Table B6). The standardized root mean square residuals (SRMR) varied from .001 to .017, in comparison to the range of .03 to .06 observed for the one-factor model without residual correlation. Lower SRMR (or RMSEA) values are indicative of a superior model fit, with zero representing a perfect fit (Urban & Mayerl, 2014).
The nested-factor models (i.e., the bi-factor model; see Figure C1) obtained a good to perfect fit in 68 countries and federal states, with RMSEA values ranging from .00 to .05 (see Table B6), which were at or below the recommended threshold of .05. For five of the six remaining countries and states, the RMSEA value was .06, while for Liechtenstein it was .10. An RMSEA value below .08 is considered indicative of acceptable model fit (Urban & Mayerl, 2014). Across all countries and federal states, the SRMR values of the bi-factor models ranged from .00 to .05, exhibiting a good to perfect model fit. An exception emerged for the Korean and Shanghai PISA data. The nested-factor models showed negative residual variance for the reading subscale Integrate and Interpret in these countries, indicating that these models were not appropriate. Consequently, this residual variance was set to zero to enable further analysis. Additionally, a starting value for the variance of PISA-g and values for fixed parameters (i.e., intercepts, variances, and residual variances) derived from prior factor model estimations were employed. Subsequent bi-factor models yielded adequate fits, with RMSEA values of .05 for Korea and .04 for Shanghai. However, a further adjusted one-factor model, incorporating correlations between the residuals of mathematics and science competence, as well as between Access and Retrieve, and Reflect and Evaluate, provided a better fit to the Korean and Shanghai PISA data (e.g., Korea: = .03 vs. .05; see Table B6). For instance, the difference between this factor model and the bi-factor model exceeded 10 points (e.g., Urban & Mayerl, 2014) in terms of Akaike information criterion (AIC) or Bayesian information criterion (BIC), favoring the further adjusted one-factor model (e.g., Korea: = –426, = –326).
Across all countries and federal states, the bi-factor factor model and the adjusted one-factor model provided an enhanced fit compared with the unadjusted single-factor model. This was evidenced by non-overlapping RMSEA confidence intervals and substantial improvements in AIC and BIC, exceeding 10 points (Urban & Mayerl, 2014). In 58 (or 46) out of 74 cases, respectively, the bi-factor model’s AIC (or BIC) was at least 11 points lower than that of the adjusted one-factor model, suggesting a superior fit (see positive changes in AIC or BIC in Table B6). In the remaining cases (excluding Korea), no significant differences in AIC values were observed between these two models. With respect to BIC, the adjusted one-factor model showed a better fit than the bi-factor model only in Kazakhstan, Liechtenstein, and Mexico. Overall, the bi-factor model exhibited superior fit in the majority of cases and was therefore selected for subsequent analyses of PISA-g and RspecF.
In all countries and federal states—except Azerbaijan, with respect to mathematical competence and the reading subscale Reflect and Evaluate—the reading literacy subscales, mathematics literacy, and science literacy total scales were found to measure the same latent construct, namely the general factor PISA-g, thereby demonstrating convergent construct validity (e.g., Kline, 2016). This was indicated by their standardized loadings (λ) on this factor, all of which were at least .70 (Hair et al., 2018). When a less restrictive factor loading threshold of .50 (e.g., Urban & Mayerl, 2014) was applied, construct validity was also supported for mathematical competence and Reflect and Evaluate in Azerbaijan. The overall mean of the standardized factor loadings for the science literacy total scale, the mathematical literacy total scale, and the reading literacy subscales on PISA-g was .87 = [.57, .94], = [.85, .99], = [.69, .90]; see Table 3). In 69, 37, and 59 out of 74 countries and states, respectively, the standardized factor loadings of the reading subscales Access and Retrieve, Integrate and Interpret, and Reflect and Evaluate on the reading-specific factor (RspecF) were below .50 (see Table B7 in Appendix B). In these cases, the reading subscales failed to demonstrate adequate convergent validity for RspecF. The grand mean of the standardized factor loadings for the reading literacy subscales on this factor was .47 (λAcRe on RspecF = [.33, .63]; λInIn on RspecF = [.39, .65], λReEv on RspecF = [.36, .56]; see Table 3).
Discriminant (or divergent) validity is established when different scales measure distinct constructs (Kline, 2016). The standardized factor loadings should be minimal (i.e., less than .30; Carroll, 1993; McDonald, 1999) on the other construct (i.e., factor) (Urban & Mayerl, 2014). Within the nested-factor models, science competence and mathematical competence exhibited discriminant validity with respect to RspecF. This is because their standardized factor loadings on the reading-specific factor were zero, as specified by the model design. In all countries and federal states, the reading competence subscales did not meet satisfactory discriminant validity, as their factor loadings on both factors were greater than .30 (see Table B7).
The extent to which PISA-g and RspecF explained the observed variance in PISA competences or reading sub-competences varied by country and federal state. PISA-g predicted between 32.49% and 88.36% of the variance in mathematical literacy, between 72.25% and 98.01% of the variance in scientific literacy, and between 47.61% and 81.00% of the variance in the reading literacy subscales (see Table 3). The percentage of variance accounted for by RspecF across the reading subscales ranged from 10.89% to 42.25%. When both factors were considered, the range of variance explained in the reading literacy subscales was between 70.93% and 99.97%. In the bi-factor models for Korean and Singapore PISA data, the residual variances of the reading subscale Integrate and Interpret were fixed to zero. This resulted in both factors explaining 100% of the variance. However, due to the squaring of the rounded factor loadings, the actual percentages are 99.73% and 99.97%, respectively (see Table B7). PISA-g was identified as the primary contributor to the observed variances. For instance, the mean standardized factor loading of the reading literacy subscales on PISA-g was .82, whereas the mean factor loading on RspecF was .47.
6.2. Testing hypotheses and examining the reading competence specificity of student characteristics
There were significant positive correlations between PISA-g (or RspecF) and the number of books at home, reading enjoyment, and paternal or maternal education in 73 (or 50), 72 (or 74), 74 (or 25), and 74 (or 23) out of 74 countries and federal states, respectively (p ≤ .05, one-tailed test; see Table 4). In these cases, the results substantiated the corresponding hypotheses (see Section 4.2). The non-significant and significant correlations of PISA-g or RspecF with the number of books and parental education ranged from weak to strong or from negligible to weak (e.g., = [.06, .56] vs. = [–.07, .13]; = .34 vs. = .06; see Table 4). According to Cohen (1988), |r| ≈ .10, .30, and .50 are regarded as the lower thresholds of small, moderate, and large correlations, respectively. All correlations between the factors and reading enjoyment ranged from negligible to strong for PISA-g and from weak to moderate for RspecF (i.e., = [–.03, .44] vs. = [.08, .36], | = .26 vs. = .21). In a total of 67 (or 53) countries and federal states, respectively, the correlational links between PISA-g (or RspecF) and delayed schooling were significantly negative, thereby supporting the relevant hypotheses (p ≤ .05, one-tailed test). The correlations between this student characteristic and the factors, irrespective of their statistical significance, ranged from negligible to moderate for RspecF and up to strong for PISA-g (i.e., = [–.22, .03] vs. = [–.68, .05]; absolute mean correlations: = .32 vs. = .10).
PISA-g exhibited a correlation pattern with the number of books at home, reading enjoyment, paternal and maternal education, and delayed schooling in 65 out of 74 countries and federal states, which corresponds to that of intelligence (see Section 4.2). For RspecF, this pattern was observed in ten countries and federal states—a considerably smaller number. In the remaining nine countries and federal states for PISA-g and 64 for RspecF, at least one of the five hypotheses concerning the correlations between these factors and the intelligence-relevant student characteristics was not supported by the data. Specifically, in 17, 18, 24, and 5 countries and federal states, respectively, one, two, three, and four of the five hypotheses for RspecF were not substantiated. With respect to PISA-g, one of the five hypotheses was not supported in only eight countries and federal states: Iceland, Korea, Japan, Norway, Romania, Tamil Nadu, Tunisia, and the United Kingdom. For Tamil Nadu and Tunisia, the correlation between PISA-g and the number of books at home and enjoyment of reading, respectively, was not significantly positive (p > .05; see Table 4). In Iceland, Japan, Korea, Norway, Romania, and the United Kingdom, a non-significant positive relationship was shown between PISA-g and the years of delayed schooling (p > .05). Kazakhstan was the only country in which two hypotheses concerning the correlations between PISA-g and reading enjoyment, as well as the years of delayed schooling, were not supported = .00, = .03, p > .05, one-tailed test).
For exploratory analyses, it was statistically tested whether delayed schooling and paternal and maternal education exhibited a weaker correlation with RspecF than with PISA-g. In the majority of countries and federal states, if not all, the results were significant, as indicated by the less-than signs without parentheses (e.g., Albania: < = –.03 < –.15; p ≤ .05, one-tailed test; see Table 4). When the less-than or greater-than symbols are enclosed in parentheses, the results are not statistically significant (e.g., Iceland: (<) = –.01 (<) –.01; p >.05). In accordance with the hypotheses stated in Section 4.2, it was also tested whether the number of books at home and the enjoyment of reading were more strongly correlated with RspecF than with PISA-g (see Table 4). In the majority of cases, if not in all, the results were non-significant. From a descriptive perspective, the correlations of these two student variables were weaker with RspecF than PISA-g in nearly all, if not all, countries and federal states. When statistically tested, the number of books and the enjoyment of reading showed significantly lower correlations with RspecF in comparison to PISA-g. Overall, across the majority of the 74 countries and federal states—if not all—the correlations between the five intelligence-relevant student characteristics and RspecF were significantly weaker than the corresponding correlations with PISA-g.
In 74 federal states and countries, significant correlations were observed between PISA-g and students’ ability to correctly assess the usefulness of effective strategies for understanding and remembering text information and for writing a text summary (p ≤ .05, two-tailed test). In 63 and 64 countries and states, analogous results were obtained between RspecF and the correct assessment of the usefulness of effective strategies for understanding and remembering text information and for writing a text summary, respectively (p ≤ .05, two-tailed test). For these countries and federal states, the results supported the pertinent hypotheses. The correlations of RspecF with the two aforementioned variables ranged from negligible to moderate, whereas those of PISA-g varied from weak to strong = [–.18, .29] vs. = [.19, .52]; = [–.13, .26] vs. = [.23, .49]; see Table 4). Significant correlations were found between PISA-g (or RspecF) and the use of control, elaboration, and memorization strategies in 73 (or 67), 60 (or 29) and 57 (or 58) out of 74 federal states and countries, respectively (p ≤ .05, two-tailed test). In these cases, the findings substantiated the hypotheses. When considering all correlations between both factors and the use of these three strategies, correlation strengths ranged from negligible to moderate for RspecF and from negligible to nearly large for PISA-g (e.g., = [–.00, .20] vs. = [.00, .43]; see Table 4).
No student characteristics showed a correlation with RspecF at a level of at least .50 (e.g., Kline, 2012) without also exhibiting a significant correlation with PISA-g. Such a variable would be indicative of RspecF, as illustrated in the bi-factor model (see Figure C1). Among all variables examined, reading enjoyment was the only one to demonstrate a significant positive correlation with RspecF in all countries and federal states. Contrary to expectations, in all 74 countries and federal states, the number of books at home and the correct assessment of the usefulness of strategies for writing a text summary and for understanding and remembering text information were not more strongly correlated with RspecF than with PISA-g. The same applies for the other reading-related student characteristics: In 73, 64, 47, and 62 countries and federal states, the use of control, elaboration, and memorization strategies, and reading enjoyment, respectively, did not show stronger correlations with RspecF than with PISA-g. In fact, the majority of countries and federal states, if not all, displayed the opposite pattern, with correlations between reading-related student variables and PISA-g being significantly higher than those with RspecF. This finding suggests that these student characteristics may not be reading-specific.
If a student characteristic is reading-specific, it should demonstrate a significantly stronger correlation with reading competence than with mathematical and scientific competence. In 49, 43, 61, and 73 out of 74 countries and federal states, the reading competence showed significantly stronger correlations with the correct assessment of the usefulness of strategies for writing a text summary and for understanding and remembering text information, the use of control strategies, and the enjoyment of reading, respectively, than mathematics and science competence with them (see Table B8 in Appendix B). In these countries and federal states, the respective student characteristics may be considered reading-specific. However, reading competence did not exhibit significantly stronger correlations with the number of books at home, the use of elaboration strategies, and the use of memorization strategies than did mathematics and science competence in 47, 57, and 41 countries and federal states, respectively. In addition, in 18, 12, and 4 cases, respectively, reading competence did not correlate significantly more strongly with the number of books at home, the use of elaboration strategies, and the use of memorization strategies than either mathematics or science competence. In all of these countries and federal states, the student variables were not reading-specific. Overall, from a descriptive perspective, the differences in the strength of correlations between reading, mathematical, and science competence and these seven student characteristics were negligible to small in most cases (e.g., = .32 vs. Books*Reading = .32 vs. Books*Science = .32; see Table 5).
7. Discussion
7.1. High latent correlations as a basis for factor extraction
Significant positive and generally strong latent correlations were observed between the reading sub-competences, as well as between these sub-competences and the mathematics and science competence, in nearly all countries and federal states (.39 ≤ rlatent ≤ .96, latent = .83). However, in Azerbaijan, the latent correlations between the mathematics and science total scales and between the reading subscales and the mathematics total scale were lower, ranging from .39 to .48. These consistently strong to very strong latent correlations suggest limited empirical discriminability among the PISA competence domains across countries and federal states. In addition to other factors (e.g., test-taking behavior; see Section 1), these correlational relationships may, to some extent, be facilitated by overlaps in item characteristics and cognitive demands—such as reasoning, abstract thinking, and comprehension—across the domains of reading, mathematics, and science. For example, reading-related processes, such as accessing and extracting, as well as integrating and interpreting, are relevant for mathematical and science items, especially when solution-relevant information must be identified within the task material. Reflecting and evaluating plays also a role in mathematical and science items to some degree. Moreover, the ability to work with and comprehend different forms of representation (e.g., text, diagrams, and tables) is a common requirement across items in all three domains. In general, a certain level of reading literacy is required for all items. Furthermore, some mathematical literacy is necessary for specific science and reading items that involve dealing with numbers in tables, diagrams, or graphs. Exploratory analyses indicate that, in a weak to strong (or moderate to strong) tendency, the strength of correlations between the overall scales of mathematical and science competence and/or the reading competence subscales increases as GDP per capita (or its natural logarithm) rises.
7.2. The replication of the factors and their correlations with student characteristics
The nested-factor model (i.e., the bi-factor model) showed an adequate to perfect fit in 68 countries and federal states. Regarding the remaining six countries and federal states, the model fit was considered acceptable (i.e., RMSEA ≤ .08) in five countries and poor in Liechtenstein (i.e., RMSEA = .10). In all countries and states, the bi-factor model and the adjusted one-factor model provided a superior fit compared with the one-factor model. This finding is consistent with previous research using various PISA data sets (e.g., Brunner, 2006, 2008; Pokropek, Marks, & Borgonovi, 2022; Pokropek, Marks, Borgonovi, et al., 2022). In most cases, the nested-factor model also exhibited a better fit than the adjusted one-factor model, which incorporated residual correlation between mathematics and science. However, it was observed that all aforementioned factor models exhibited inadequate model fits for Korean and Shanghai PISA data. In these two cases, a further adjusted one-factor model provided a good to perfect fit to the data, thereby indicating its superiority over the other models.
Within the nested-factor models, the high correlations between the reading competence subscales could be statistically accounted for by PISA-g and RspecF, whereas the correlations between these subscales and science or mathematical competence, as well as the correlation between mathematical and science competence, could be attributed to PISA-g. In all countries and federal states—except for Azerbaijan, in the case of mathematical competence and Reflect and Evaluate—the mathematics and science competence scales and the reading subscales measured the same latent construct, PISA-g, thereby demonstrating convergent construct validity. This was indicated by their standardized factor loadings on this factor, which were equal to or greater than .70. The overall mean of the standardized factor loadings of these competences and sub-competences on PISA-g was .87. In most cases, the reading subscales did not demonstrate adequate convergent validity with respect to RspecF. The grand mean of the standardized factor loadings for the reading literacy subscales was .82 on PISA-g and .47 on RspecF. As indicated by the magnitude of the standardized factor loadings, the degree to which PISA-g and RspecF explained the observed variance in PISA competences and reading sub-competences differed across countries and federal states. Specifically, PISA-g accounted for between 32.49% and 88.36% of the variance in mathematical literacy, between 72.25% and 98.01% of the variance in scientific literacy, and between 47.61% and 81.00% of the variance in the reading literacy subscales. The percentage of variance explained by RspecF across the reading subscales ranged from 10.89% to 42.25%. PISA-g was found to be the dominant contributor to most of the variance explained in the reading competence subscales and in mathematics and science competence. Consequently, these subscales and competences may reflect general cognitive ability (i.e., PISA-g) more strongly than domain-specific abilities.
PISA-g demonstrated significant positive correlations with maternal and paternal education in all countries and federal states as well as with the number of books and the enjoyment of reading in nearly all cases. A significant negative correlation between this factor and delayed schooling was identified in nearly all countries and federal states. Therefore, the relevant hypotheses were substantiated in those countries and federal states. As expected, the reading-specific factor demonstrated also significant positive or negative correlations with the aforementioned variables, but in a considerably smaller number of countries and federal states, with the exception of the enjoyment of reading. The correlations of PISA-g with the number of books and maternal and paternal education ranged from weak to strong; those with enjoyment of reading and delayed schooling ranged from negligible to strong. In nearly all cases, the correlations between these student characteristics and RspecF were found to be considerably weaker than those observed with PISA-g. All five hypotheses regarding the correlations between PISA-g and the aforementioned five intelligence-relevant student characteristics were supported in a total of 65 countries and federal states. Consequently, in these cases, PISA-g showed a pattern of correlations with these intelligence-relevant student characteristics, which is analogous to that of intelligence. RspecF exhibited an intelligence-related correlational pattern with the same five student variables in only ten countries and federal states. In these cases, the correlations were found to be significantly (and considerably) weaker. Unlike PISA-g, RspecF displayed a much less consistent intelligence-related correlation pattern across most countries and federal states. These findings, along with the intelligence-related PISA item demands (see Sections 3.1 to 4.1), support the assumption that PISA-g reflects a general cognitive ability (i.e., an intelligence-like ability). For instance, it encompasses the intelligent application of knowledge and given information.
PISA-g and RspecF demonstrated significant correlations with metacognitive and learning strategies in varying numbers of countries and federal states. The metacognitive strategies comprise the correct assessment of the usefulness of effective strategies for understanding and remembering text information as well as for writing a text summary. The correlations between RspecF and these two metacognitive strategies ranged from negligible to moderate, whereas the correlations of them with PISA-g varied from weak to strong. When all the correlations between the two factors and the use of the three learning strategies (control, elaboration, and memorization) are taken into account, their strengths ranged from negligible to moderate and, for PISA-g, up to nearly large. No student characteristics were found to correlate with RspecF at a level of at least .50 while at the same time not correlating significantly with PISA-g. Such a variable would be indicative of RspecF, as illustrated in the bi-factor model. The precise nature of this factor remains an open question.
Contrary to expectations, in the majority of countries and federal states—if not all—the correlations between the reading-related student variables and RspecF were not significantly stronger than their correlations with PISA-g. A student characteristic may be regarded as reading-specific if it shows significantly stronger correlations with reading competence than with mathematical and scientific competence. According to this criterion, the correct assessment of the usefulness of effective strategies for writing text summaries and for understanding and remembering textual information, the use of control strategies, and the enjoyment of reading were reading-specific; the first three in most countries and federal states and the latter in all cases, except Tunisia. However, the number of books at home, the use of memorization, and the use of elaboration strategies were not reading-specific in most or nearly all countries and federal states. Although certain student characteristics were found to be reading-specific, they generally exhibited a stronger correlation with PISA-g than with RspecF in most cases, or in all cases, depending on the specific student characteristic under consideration.
7.3. Criticism and implications
For the PISA 2009 items, for which response options were provided, students might also have guessed the correct answer, thereby potentially compromising the validity of these items. It is also plausible that guessing techniques may enhance the correlation between PISA competences and intelligence.
The utilization of manifest correlations has the potential to facilitate a more precise empirical differentiation between the reading competence subscales and other competences (e.g., German PISA 2000 data: rAcRe*InIn = .74manifest versus .94latent, rAcRe*ReEv = .64manifest vs. .88latent, rInIn*ReEv = .71manifest versus .91latent; Artelt & Schlagmüller, 2004). However, the persistent high latent correlations suggest the need to modify the PISA items themselves to align more closely with greater dimensional specificity. As a preliminary step, it is essential to identify and mitigate the similarities between the competences, including the reading subscales, as discussed in Sections 3.1 and 3.2.
The high variance explanation of the mathematical and science competence accounted for by PISA-g can also be partly due to the chosen specification of the nested-factor model. For instance, the inclusion of an additional specific factor for each of these competences within the model could potentially result in a reduced variance explanation by PISA-g. However, the PISA 2009 data set encompassed only overall scales for mathematics and science competence, thereby precluding the extraction of further competence-specific factors, for example, from the subscales of mathematics and science competence. Instead of assuming a reading-specific factor, the correlation between the reading subscales could also be attributed to a common method variance between them (Brunner, 2008), that is, a method factor.
In previous factor analyses (e.g., Brunner, 2006, 2008; Pokropek, Marks, & Borgonovi, 2022), the two subtests (word and figure analogies) of the Cognitive Ability Test (Heller & Perleth, 2000) and the Raven’s Standard Progressive Matrices (Jaworowska et al., 2000) were utilized. However, this is not sufficient for a comprehensive assessment of intelligence. Consequently, a broad intelligence test battery should be considered in conjunction with the PISA competences at the overall, subscale, and item levels in future factor analyses. This would facilitate comprehensive empirical validation of PISA-g, for instance, in terms of an ability analogous to intelligence or less. Furthermore, a comparative analysis of the PISA items with those of various intelligence tests is necessary to identify similarities in content and cognitive demand.
Given the substantial sample sizes, even negligible correlations or minor differences between correlation coefficients can attain statistical significance. Consequently, a student characteristic may appear to be reading-specific merely because its correlation with reading competence is marginally—but significantly—higher than with other competences. Therefore, it is essential to systematically assess the magnitude of these correlations in addition to their statistical significance.
It is recommended that subsequent PISA studies incorporate a comprehensive intelligence measure in conjunction with an approximately representative sample of items from the three competence domains (reading, mathematics, and science). This approach enables a thorough evaluation of PISA-g in factor analysis. In order to compute manifest correlations between domains at the item or total scale level, students must be administered a representative sample of PISA items for each domain. The divergent empirical validity of competences can then be evaluated on the basis of such correlations. In addressing the issue of motivational losses resulting from elevated demands during a single testing occasion, it is recommended to implement measurements at two distinct time points. This approach may help mitigate low test-taking effort, which can lead to student underperformance (e.g., Borger et al., 2025; He et al., 2025). Furthermore, an analysis of tasks across all subscale items within a given domain compared with other domains is advised to identify shared characteristics specific to that domain. This procedure may facilitate deriving a description of a domain-specific factor.