
Role of Mental Abilities and Conscientiousness in Explaining College Grades
The prediction of college academic performance, often measured using grade point averages (GPAs), continues to be a research topic in applied psychology (e.g., Biderman et al., 2018; Dahlke et al., 2019; Moore & Ones, 2019). Applied psychologists are involved in developing and validating academic testing programs (e.g., MCAT, SAT, ACT) and those in academia have grants to study predictors of academic performance (Sackett et al., 2008; Schmitt et al., 2011) and publish related research (e.g., Kuncel et al., 2001, 2007; Kuncel & Hezlett, 2007).
Criterion-related Validity of g and s in Work Settings
Research on predictors of job and training performance indicated that g is primarily responsible for the predictive power of standardized tests of mental abilities, with specific abilities often adding little or nothing to prediction of performance (e.g., Brown et al., 2006; Ree et al., 1994; Ree & Carretta, 2022). However, there have been recent calls to reexamine the importance of specific abilities in personnel selection, including a series of articles in a special issue of the Journal of Personnel Psychology (Krumm et al., 2014) and an article by Murphy (2017), which suggested the conclusion that specific abilities add little value was “premature.” Indeed, a study by Nye et al. (2022) provided evidence that the incremental validity of specific abilities over g is greater when for those specific abilities with correlations with g and Briet et al. (2024) reported higher incremental validity for specific abilities that are aligned with a criterion.
Criterion-related Validity of g and s in Academic Settings
In contrast to the large body of research on the role of g vs. specific abilities in predicting job/training performance, there is considerably less research on this topic using academic performance. Much of the large-sample research focuses on the validity of specific operational tests (e.g., the SAT, the ACT), which include only a small number of subtests. Jensen (1998) noted the lack of research, stating “Surprisingly little of this applied literature on test validity, however, examines the degree to which g itself, as compared to other factors and specificity, contributes to tests’ validity. Fortunately, the few studies that focus specifically on this question have been conducted by the armed forces and by the U.S. Employment Service of the Department of Labor [i.e., Hunter & Schmidt]. These studies, based on huge samples, are technically excellent” (p. 271). More recently, Peng and Goodrich (2020) noted that g strongly predicts academic success with a validity coefficient of .42, reinforcing the dominance of general cognitive ability over specific abilities in academic performance.
One exception is a study by Cucina et al. (2016) who examined the criterion-related validity of g vs. specific abilities in predicting high school academic performance using two datasets. In the first dataset, they used the Armed Forces Vocational Aptitude Battery (ASVAB) to predict high school GPAs (obtained using transcripts) and found that much of the criterion-related validity was due to g. In the second dataset, they used mental abilities test scores from Project TALENT, a large nationwide study conducted by I/O psychologist John Flanagan and associates (1964). Self-reported GPA served as the criterion and big five personality scale scores served as a secondary predictor. Again, much of the criterion-related validity was due to g (specific abilities often lacked incremental validity). One exception that occurred in both studies was that mathematical knowledge added incremental validity over g.
There is strong evidence that conscientiousness adds predictive validity. A meta-analysis by Mammadov (2022) found that cognitive ability and conscientiousness were both strong predictors of multiple levels (including undergraduate) of academic performance and that conscientiousness added incremental validity. Another meta-analysis by Vedel (2014) reported that among the big five, conscientiousness was the strongest predictor of GPA. Friedrich and Schütz (2023) found conscientiousness and intelligence independently predict grades in 3,775 German 13th-graders, with no interaction, supporting independent effects and rejection of a multiplicative model. Lechner et al. (2021) found g and conscientiousness independently predict achievement in 18,637 German students, with weak math synergy. Wang and Zhang (2021) showed cognitive ability and self-control, akin to conscientiousness, independently predicted high school performance without interaction, suggesting applicability to college settings.
The Role of High School (HS) GPA in Predicting College GPA
The use of standardized testing for college admissions remains controversial, with many critics arguing for more weight given to HS GPA or the use of HS GPA in lieu of standardized test scores. Even proponents of the SAT and ACT (e.g., Kobrin et al., 2011) suggest test scores and HS GPA should be used in combination (e.g., using a regression equation). A large study by Mattern and Patterson (2013) indicated that HS GPA has an observed validity of .370 (compared to .367 for the SAT) and adds incremental validity (multiple R = .468) using Freshman GPA as the criterion. Cucina et al. (2016) found that HS GPA correlated .32 to .40 with g and .32 with conscientiousness.
Based on the overlap and intercorrelations between g, HS GPA, and college GPA, it is important to include HS GPA in any studies examining the contribution of g vs. specific abilities to predicting college GPA. Additionally, it might be possible that HS GPA has a mediatory role in the relationship between the individual differences of g and conscientiousness with college GPA. These individual differences may lead to individual differences in HS GPA, which in turn lead to individual differences in college GPA. Harackiewicz et al. (2002) reported that semester grades in psychology courses mediated the relationship between ability, goals, and high school performance in predicting grades later in student’s undergraduate careers. Research by Radunzel and Noble (2012) and Sanchez (2024) indicates that first-year college grades play a mediating role in the prediction of college degree completion and cumulative college grades by admissions predictors (e.g., ACT scores and high school grades).
Overview of Study and Hypotheses
In this study, we extended the work of Cucina et al. (2016) who examined the validity of mental ability tests and conscientiousness in predicting HS GPA using the Project TALENT dataset. Their work focused on the base year data collection of Project TALENT, which included over 300,000 participants (American Institutes for Research, 1960a/b). A five-year follow-up study was later conducted and included self-reported college GPA, which was not included in either the dataset or used by Cucina et al. (2016).
We examined the criterion-related validity of a large battery of mental abilities tests, HS GPA, and a measure of conscientiousness in the prediction of college GPA. Past research suggests that g, not s, predicts job, training, and performance, thus we predict the same finding for our study (Hypothesis 1), with one exception noted below. We hypothesized that conscientiousness will predict college GPA (Hypothesis 2), based on past meta-analyses (e.g., McAbee & Oswald, 2013). Our third hypothesis is that conscientiousness and g will interact when predicting performance, following the classic equation (Maier, 1955; Vroom, 1960, 1964):
Performance = motivation × ability
Our fourth hypothesis is that mathematical knowledge will add incremental validity over g, based on research by Cucina et al. (2016); this is the exception to Hypothesis 1. Hypothesis 5 states that HS GPA will mediate the prediction of college GPA from g and conscientiousness.
We used the dataset for the Project TALENT study; although it was conducted some time ago, it makes up for its age by virtue of the sheer size of the dataset and the number of tests administered. Project TALENT has data on over 300,000 high school students on a battery of 59 mental abilities tests as well as personality tests and other measures (e.g., interests, background questionnaires). Of these students, 35,446 participated in the five-year follow-up study and obtained a Bachelor’s degree, and self-reported college grades.
This dataset has been used in a large number of studies, primarily conducted in the 1960s-1970s (e.g., Cureton, 1968; see Campbell, 1979); however, it continues to be used in research today (e.g., Arneson et al., 2011; Major et al., 2012; Reeve, 2001, 2004; Reeve et al., 2006; Waters, 2007). Despite a current bibliography of over 356 publications, we were unable to locate a study that investigated the relationship between the 59 mental abilities tests, conscientiousness, HS grades, and college GPA. One exception is the study by Arneson et al. (2011) who investigated the linearity of the relationship between a composite cognitive measure from the dataset and college GPA for 15,040 participants. As the focus of their study was on the linearity of test-performance relationships, they did not test the central hypotheses in our study.
Method
We used the base- and five-year follow-up datasets from Project TALENT (American Institutes for Research, 1960; Flanagan, 1973; Flanagan et al., 1961, 1964, 1971a, 1971b; Flanagan & Jung, 1971; Wise et al., 1979). The Project TALENT researchers provided a credibility index for each participant and suggested that cases with an unacceptable index should be removed before conducting analyses, which we did. We removed cases with missing data on one or more of the abilities. It was necessary to remove these cases because scores on all tests were needed to compute variables for g. Replacing missing values using expectation-maximization did not have a substantive impact on the correlations between the variables of interest; therefore, we decided against replacing missing values. Finally, we removed participants who had not obtained a Bachelor’s degree and that lacked college GPA data from the five-year follow-up study. Table 1 presents the demographics for the cases in our final dataset.
HS GPA. In addition to completing the mental abilities tests, participants also completed a “Student Information Blank” which contained background questions. Eight questions concerned HS grades and the Project TALENT researchers created a weighted composite using seven of these questions. The items and weights are provided in Table 2 and were obtained from pages 36 and R-4 of Wise et al. (1960). The Project TALENT participants collectively attended 1,214 schools, and there were 1,095 schools that had 30 or more cases in the data. We also converted HS grades (for schools with 30 or more cases) to z-scores to address the possibility that different schools might have different grading standards.
College GPA. The five-year follow-up survey included the following question: “As an undergraduate what is or was your average grade in your major subject and all subjects?” Participants indicated the letter grade corresponding to the average grades in their major and overall. We used the overall GPA as the criterion. We recoded the letter grades into a traditional 4-point system (i.e., A=4; A-=3.7; B+=3.3; B=3; B-=2.7; C+=2.3; C=2; C-=1.7; D+=1.3; D=1; D-=.7). The use of self-reported grades is a limitation; however, Kuncel et al. (2005) found that self-reported HS grades have an observed correlation of .82 with grades from school records and college grades had a correlation of .90. They stated that self-reported grades “generally predict outcomes to a similar extent as actual grades” (p. 76).
Conscientiousness. Ten personality scales were administered with the Project TALENT mental abilities tests. Similar to Cucina et al. (2016), we used Reeve et al.'s (2006) work to compute big five scale scores.
Mental Abilities Tests. In Table 3, we present the names/abbreviations for all tests. Each test was rationally linked to Carroll’s (1993) three-stratum-theory. Major et al. (2012) independently linked a subset of the tests to Carroll’s abilities. Both linkages were used and are shown in Table 3. In general, the first half of the tests measure crystallized intelligence and Flanagan et al. (1962) included these “Information” tests as measures of general knowledge (especially knowledge gained through general life rather than formal schooling) and these fall squarely within Carroll’s (1993, p. 624) definition of crystallized intelligence (i.e., “mental processes that reflect… the effects of experience, learning, and acculturation”). The remaining tests measure specific abilities such as verbal, quantitative, spatial, perceptual speed, and memory. An analogue to the Raven’s Progressive Matrices (Raven et al., 2004), Test 290 Abstract Reasoning, was also administered.
Results
Descriptive statistics and reliabilities for the research variables are provided in Table 4. To address Hypothesis 1, we examined the criterion-related validity of the tests. These analyses are summarized in Table 5.
We computed the bivariate observed correlation (robs) between each test and college GPA. Using the final restricted raw dataset, we conducted a Principal Component Analysis (PCA) on the tests and computed scores on the first unrotated principal component to serve as an estimate of g (see Jensen & Weng, 1994, for a justification). Two types of g scores were computed, one using all 59 tests, and the other omitting the Information tests. We also computed the operational validity (ρov), which corrects for criterion unreliability and multivariate range restriction (using the full sample of over 300,000 cases to estimate unrestricted variance-covariance matrix) and the true score validity (ρTS), which corrects for multivariate range restriction and predictor and criterion unreliability (using the full sample to estimate reliabilities). A PCA was also conducted on the full unrestricted Project TALENT dataset (which also included data from individuals that did not attend college). The scoring weights for both types of g scores were obtained and later used with the multivariate corrected correlation matrix to compute composite g and personality scores.
Multivariate range restriction was used instead of direct range restriction. The latter is most applicable to situations on which applicants are selected on a predictor test and criterion-related validity is measured using a restricted sample that passed the predictor test. The Project TALENT mental abilities tests were administered for research purposes and were not used to make college admissions decisions. However, given the use of college admissions requirements, including standardized admissions testing (e.g., the SAT), at the time Project TALENT was conducted, it is likely that range restriction occurred. Since direct range restriction corrections can underestimate corrected validity coefficients when selection is not direct (see Hunter et al., 2006), a multivariate range restriction correction procedure was conducted. Multivariate range restriction correction allows for range restriction corrections to be made simultaneously on a battery of predictor tests, such as the Project TALENT mental abilities tests. It also allows for corrections when differential range restriction occurs on a set of correlated predictors, which is possible for the Project TALENT mental abilities tests. A Monte Carlo simulation by Fife et al. (2016) indicated that multivariate range restriction corrections (conducted using the Pearson-Lawley method) “almost always do as good or better than” Hunter et al.'s (2006) Case IV corrections (which are considered a state-of-the-art procedure by many meta-analysts). Participants took the Project TALENT mental abilities tests in either the 9th, 10th, 11th, or 12th grade. Multivariate range restriction corrections were conducted separately for each grade using each grade’s unrestricted and restricted variance-covariance matrices.
To make the corrections, the restricted and unrestricted correlation matrices were obtained. Next, the correlations involving the criterion (i.e., college GPA) were corrected for criterion unreliability and the standard deviation for the criterion was adjusted using formula 6-28b from Nunnally and Bernstein (1994) so that it reflected the standard deviation of criterion true scores rather than the standard deviation for observed scores. The correction was conducted on the restricted correlation matrix since criterion reliability is assessed using a restricted sample (see Hunter et al., 2006). After converting these to variance-covariance matrices, the psychmeta package (Dahlke & Wiernik, 2019) in R was used to conduct the multivariate range restriction corrections. Next, the iopsych package (Goebl et al., 2016) in R was used to compute composite scores (e.g., personality scale scores, principal component scores, which are described above) for the corrected correlation matrix. After making all four corrections, a sample size-weighted Fisher z average was obtained across the four grade levels. The Fisher z values were then converted back to correlation coefficients and an operational validity matrix was produced. Finally, using the reliabilities from the full unrestricted sample, a true score corrected correlation matrix was also produced. The matrices were then imported into SPSS and regression analyses were conducted on the matrices to examine the operational and true score incremental validities for each test over g.
In the final restricted raw dataset, the g scores using all 59 tests had an observed criterion-related validity of .27. Correcting for multivariate range restriction and criterion unreliability yielded an operational validity (ρov) of .38. Further correcting for predictor reliability yielded a true score validity (ρTS) of .38 as well. The g scores that omitted crystallized knowledge had an observed validity of .32, an operational validity of .41, and a true score validity of .42. We focused our analysis on the g scores omitting crystallized knowledge since these had slightly higher criterion-related validity. We computed the partial correlations (robs.g) between each subtest and college GPA, controlling for the g scores, and we ran a series of regression analyses and recorded the incremental validity (ΔRobs) and observed standardized regression weights (βobs). The regression analyses were also conducted on the multivariate corrected correlation matrix to yield operational incremental validity estimates (ΔROV) and associated standardized regression weights (βOV).
Following recommendations by Schmidt et al. (1981), Schmidt and Hunter (1996, scenario 6), and Schmidt (2011), we also corrected the multivariate corrected correlation matrix for predictor unreliability and ran a true-score regression analysis to obtain true score incremental validities (ΔRTS) and true score standardized regression weights (βTS). These results can be found in Table 5. Note that the corrected true score correlation between the Etiquette Information Test (T144ETIQ) and g exceeded 1.00 and its β-weight and ΔR are reported as not applicable in Table 5.
Finally, we conducted three sets of Structural Equation Models (SEMs) using the two factor structures described earlier. We first estimated the standardized regression path coefficients from g to the criterion. Next, leaving the path from g to the criterion intact (and fixing it to the first value), we added a path from a second factor (e.g., 2C) to the criterion and recorded its estimate. This serves as an estimate of the unique contribution of the s factor over and above g. We repeated this analysis for each of the remaining factors; however, we only included two paths (one of which was from g, the other from the target factor) to the criterion in each model. We then conducted this analysis at the test score level; we conducted 59 SEMs, all of which had a path from g to the criterion and each of which had a different subtest-to-criterion path. For example, one model had paths from g, 2F, and Test 290 to the criterion and another had paths from g¸2Y, and Test 211 to the criterion.
The SEMs were conducted twice, once using our linkage of the tests to Carroll’s (1993) factors and once using Major et al.'s (2012) linkage. To provide a better modeling of the factor structure, we included data from 486 cases that had scores on all tests, graduated from college, but lacked criterion data (using AMOS’s estimate means and intercepts option to handle the missing data). The fit statistics for CFAs of the Carroll linkage were mixed (χ2=261,426, df =1,642; CFI=.715; RMSEA=.066); however, those for the Major et al. linkage were better (χ2=66,263, df =599; CFI=.893; RMSEA=.055). We computed the model implied correlation between each subtest and college GPA using the model that only allowed g to load onto college GPA. The model implied correlations are shown in Table 5 along with the difference between them and the observed validities.
The test scores and the g scores were significantly related to college GPA. However, after controlling for g, the unique variance of the test scores had either negative validities or small validities that were often less than .10 (i.e., “Irish validities,” according to Kunin, 1965, and Seberhagen, 2007). There were four exceptions. The Word Functions in Sentences Test (T240WORD) had a partial correlation, β-weight, and standardized SEM path in excess of .10. This finding held up after correcting for multivariate range restriction and predictor reliability. The Bible Information Test (T142BIBL) and the Punctuation Non-Information Test (T233PUNC) had corrected operational validity standardized regression weights that were .10 or higher. Several more tests had corrected true score validity standardized regression weights that were .10 or higher, but are not discussed here since their operational validities were not .10 or higher. Additionally, the 2Y and A6 factors in the SEM had standardized paths of .10 or higher.
The observed validities were very close to those implied by the SEM model that only allowed g to predict, suggesting that much of the correlation between the tests and college GPA is attributable to the relationship between g and college GPA. Only two tests (T240WORD and T410ARIT) had observed correlations that were .10 or higher than the SEM model-implied correlations, suggesting that g did not capture all of the validity of these two tests. Thus, we found strong support for Hypothesis 1. In contrast to Cucina et al. (2016), we did not find that the two math knowledge tests (T106MATH and T312MTH2) added positive incremental observed validity over g. Neither test had appreciable operational or true score incremental validity over g, but both did have true score standardized regression weights of .10 or higher. That said, it was concluded that Hypothesis 4 was not supported.
Hypothesis 2 was supported as conscientiousness had an operational validity of .22. Although the other big five factors predicted the criterion, they did not add incremental validity over Conscientiousness.
To address Hypothesis 3, we used Hayes (2017, 2019) PROCESS 3.3 SPSS macro to determine if there was an interaction between conscientiousness and the g scores in predicting college GPA. Although statistically significant, this interaction term did not add appreciable incremental validity over the main effects (ΔR<.01). A ‘pick-a-point’ analysis of simple slopes indicated the conditional effects of the g scores at the 16th, 50th, and 84th percentiles to be .19 (p<.001), .20 (p<.001), and .21(p<.001), respectively. There were no statistically significant transition points using the Johnson-Neyman method within the range of Conscientiousness scores.
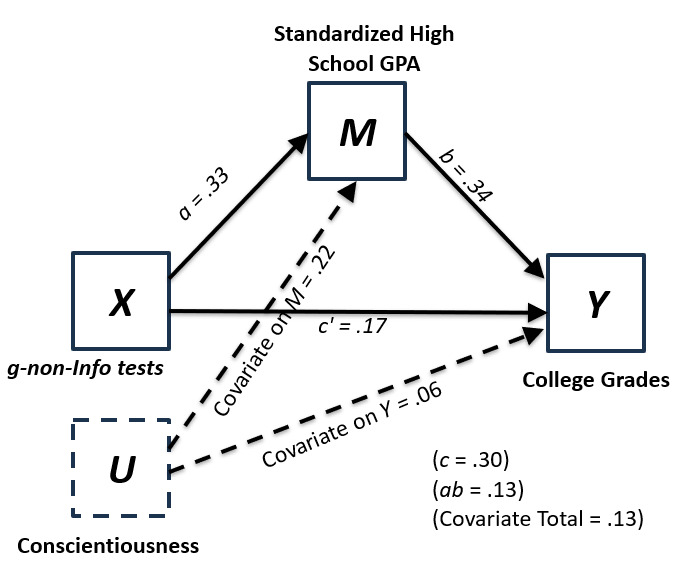
Hypothesis 5 was tested using model 4 of Hayes (2017, 2019) PROCESS 3.3 SPSS macro with g serving as the predictor and conscientiousness serving as a control with both being mediated by HS GPA in the prediction of college GPA. We ran this analysis twice (switching the roles of g and conscientiousness). The results can be found in Table 6, with a graphical depiction of the mediation models in Figures 1 and 2. The direct and indirect effects of both predictors were significant (as evidenced by confidence intervals not including zero after 10,000 bootstrap samples) providing support for mediation and Hypothesis 5, albeit with a small standardized effect size.

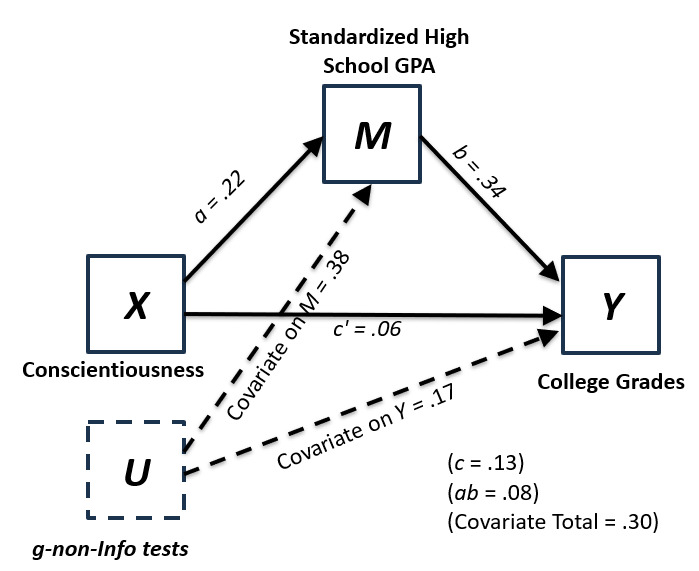
Finally, we also performed multiple regression using g (βobs=.17; βOV=.26; βTS=.24), conscientiousness (βobs=.06; βOV=.07; βTS=.05), and HS GPA (βobs=.34; βOV=.33; βTS=.37) to predict college GPA and obtained a multiple R of .46 (ρOV = .52; ρTS =.54).
Discussion
The results of this study have implications in several domains. First, the finding that g predicts college GPA is particularly relevant for the ongoing discussion and criticism about college admissions tests. College admissions tests are g-loaded and provide a standardized method to compare and contrast college candidates from different backgrounds and high schools. They are also a way to admit students to colleges who are most likely to have success and by extension complete college and graduate. The finding that g predicts college GPA reinforces the legitimacy of using college admissions tests as part of the process to admit students into college. However, the lack of support for the traditional multiplicative model between motivation (defined here as conscientiousness) and ability does not apply to collegiate academic performance (given the miniscule interaction effect). Sackett et al. (1998) reported similar results for job performance; however, interaction effects are difficult to detect (McClelland & Judd, 1993) and additional research could be conducted.
Second, our finding that individual tests had very small validities with the criterion after controlling for g provides further disconfirmation of specific aptitude theory and suggests that the past I/O research we reviewed for the role of g versus specific abilities in the prediction of job and training performance also extends to college GPA. Those looking to predict college performance would do well to use a g-loaded predictor, such as general aptitude and ability tests, instead of predictors in sub-areas or domain-specific abilities. Future research should examine the role of g and specific abilities in predicting academic performance in primary and middle school.
There are several limitations to our study. The dataset is several decades old and so the results of this study should be replicated with newer data. Such a replication might include additional specific ability tests to better capture the 69 narrow abilities in Carroll’s (1993) Three-Stratum Theory and improve incremental validity over g and more current/up-to-date content in the Information tests. Second, the self-report for the collection of GPA data could have resulted in inaccuracies (e.g., inflation or embellishment). Third, our analyses did not include individuals who started but did not complete a Bachelor’s degree as we decided to focus on final overall cumulative grades rather than grades for Freshmen, for example. Finally, some of the tests included in Project Talent had low reliabilities. Thus, there is room for more investigation into specific aptitude theory.
Author Note
Portions of this paper were previously presented at the 2020 annual meeting of the Society for Industrial and Organizational Psychology. The views expressed in this paper are those of the authors and do not necessarily reflect the views of U.S. Customs and Border Protection or the U.S. Federal Government.