Tilt refers to an ability pattern based on within subject differences in two distinct cognitive abilities (e.g., technical and academic), yielding relative strength in one ability (e.g., academic) and weakness in another (e.g., technical) (for reviews, see Coyle, 2018a; Coyle & Greiff, 2021; Lubinski, 2009, 2016). A common type of tilt is ability tilt based on differences in math and verbal scores on college aptitude tests (e.g., SAT, ACT, PSAT), yielding math tilt (math > verbal) and verbal tilt (verbal > math) (for reviews, see Coyle & Greiff, 2021; Lubinski, 2009, 2016; see also, Coyle, 2016, 2019; Coyle et al., 2014, 2015; Lubinski et al., 2001; Park et al., 2007). A more recent type of tilt, and the focus of the current investigation, is tech tilt, based on differences in technical (mechanical, electrical, automotive) and academic (math or verbal) scores on vocational aptitude tests, yielding tech tilt (technical > academic) and academic tilt (academic > technical) (Coyle, 2019, 2020, 2022, 2023b).
Tilt scores are weakly related or unrelated to general intelligence (g; variance common to mental tests) but differentially predict outcomes in science, technology, engineering, and math (STEM) and the humanities (e.g., history, English, philosophy) (Coyle, 2018a, pp. 7–8; Coyle & Greiff, 2021; Lubinski, 2009, 2016). The outcomes predicted by tilt include college grades, college majors, college degrees, and jobs. In general, math tilt and tech tilt predict STEM outcomes, while verbal tilt predicts humanities outcomes. The predictive power of tilt is surprising because tilt is largely non-g, and g largely explains the predictive validity of tests (e.g., Jensen, 1998, pp. 274–294). Despite its negligible relation to g, tilt still predicts outcomes at work and school (cf. Kato & Scherbaum, 2023; see also, Coyle & Greiff, 2021; Lang & Kell, 2020).
Tilt levels increase with age in adolescence from 13- to 17-years (Coyle, 2022, 2023b; see also, Woodley of Menie et al., 2025). The increases in tilt have been attributed to differential investment (time and effort) in different domains, a pattern consistent with investment theories (e.g., Cattell, 1987, pp. 138–146; see also, Coyle, 2018a; Coyle & Greiff, 2021, 2023; von Stumm & Ackerman, 2013). Investment theories assume that increases in math tilt and tech tilt are attributable to investment in STEM, which involves math and tech skills, while increases in verbal tilt are attributable to investment in the humanities, which involves verbal skills. Tilt levels also increase with faster mental speed, a finding consistent with processing speed theories (Coyle, 2022, 2023b; see also, Kail, 1991, 2000). Such theories assume that increases in speed facilitate the acquisition of specific abilities (e.g., technical, math, verbal), producing analogous types of tilt.
The current study is the first to examine the predictions of magnification theories (Coyle, 2018a, p. 12; see also, Coyle, 2015, 2025; see also, Brown et al., 2021). Magnification theories predict that tilt levels accelerate at higher levels of age and speed, which facilitate the acquisition of specific skills (e.g., technical or academic) that produce tilt. The predicted pattern should produce quadratic effects of age and speed on tilt. Such effects can be depicted on a graph with age and speed on the x-axis and tilt level on the y-axis, with a curve bending up from the origin as tilt levels are magnified at higher levels of age and speed.
The current study tested the predictions of magnification theories by examining nonlinear effects of age and speed on tilt from 13- to 17-years, a period of rapid increases in g, processing speed, and specific abilities (e.g., Jensen, 2006, pp. 91–94; see also, Coyle et al., 2011; Fry & Hale, 1996; Kail, 1991, 2000; Tourva & Spanoudis, 2020). Nonlinear effects were operationalized as quadratic effects of age and speed on tilt. If tilt levels are magnified at higher levels of age and speed, then quadratic effects of age and speed should predict tilt levels beyond linear effects.
The current study also tested predictions of processing speed theories in adolescence (Coyle, 2019, 2020; see also, Kail, 1991, 2000). Such theories assume that mental speed facilitates the acquisition of specific abilities (e.g., technical and academic) and that increases in mental speed accelerate the acquisition of such abilities, boosting tilt at older ages. An implication of such theories is that speed-tilt relations should strengthen at older ages, as the effects of speed on tilt accumulate over time (Coyle, 2022, 2023b). Consistent with this prediction, age should moderate speed-tilt relations, which should strengthen at older ages.
The effects of age and speed on tilt were predicted to be independent of g, for two reasons. First, whereas g is assumed to affect all abilities, age is assumed to affect specific abilities via differential investment in specific domains (e.g., technical or academic), suggesting that age effects are distinct from g effects. Second, whereas g is related to all abilities (e.g., technical, academic, speed), processing speed targets the ability to process and learn information efficiently (Kail, 1991, 2000; Salthouse, 1996), boosting the acquisition of specific abilities that produce tilt. Despite their theoretical differences, age, speed, and tilt have been found to be related to g in adolescence (Coyle, 2022, 2023b, 2025). Therefore, to assess their independence, the effects of age and speed on tilt were estimated before and, in supplemental analyses, after controlling for g.
The current study differed from prior tilt research in adolescence in two important ways. First, prior research examined whether processing speed mediated age-tilt relations and found that speed largely explained age-related increases in tilt (Coyle, 2022, 2023b; see also, Fry & Hale, 1996; Tourva & Spanoudis, 2020). In contrast, the current study examined whether age moderated the strength of speed-tilt relations and whether age and speed effects on tilt were nonlinear. According to investment and magnification theories (Coyle, 2018a, p. 12), the effects of age and speed on tilt should accelerate (via more investment and faster speeds) at higher levels of each variable, producing nonlinear effects. Second, prior research examined linear and nonlinear effects of g on tilt (ignoring age and speed) (Coyle, 2025; see also, Brown et al., 2021). The key finding was that the effects of g were primarily linear, with tilt increasing at higher levels of g, a pattern supporting differentiation theories (Coyle, 2025). In contrast, the current study examined the effects of age and speed (rather than g) on tilt. Consistent with investment and magnification theories, the effects of age and speed should be magnified at higher levels of age and speed (even after controlling for g), producing nonlinear effects.
The predictions were tested using the 1997 National Longitudinal Survey of Youth (NLSY), a large and representative sample of 13- to 17-year-olds in the United States (Hering & McClain, 2003, pp. 1–14). Following prior research (for reviews, see Coyle, 2018a, 2023a; Coyle & Greiff, 2021, 2023), tilt was based on test scores from the Armed Services Vocational Aptitude Battery (ASVAB), a selection test used by the United States military. The ASVAB produces a strong g factor and correlates strongly with IQ tests (Coyle, 2015; Frey & Detterman, 2004; Koenig et al., 2008). The ASVAB includes 12 tests of four abilities: math, based on tests of arithmetic reasoning and math word problems; verbal, based on vocabulary knowledge and paragraph comprehension; technical, based on knowledge and comprehension of mechanics, electronics, automobiles, and shop tools; and speed, based on speed in completing simple coding charts and arithmetic problems. The four abilities are sensitive to age differences in adolescence (e.g., Coyle et al., 2011; see also, Coyle, 2022, 2023b; Kail, 1991, 2000). The abilities have been validated using factor analysis and latent variable modeling with the ASVAB (e.g., Coyle & Pillow, 2008; Ree & Carretta, 1994; Schmidt, 2011).
Following prior tilt research (for reviews, see Coyle, 2018a, 2023a; Coyle & Greiff, 2021, 2023), tilt was based on contrasts of technical and math scores, yielding tech tilt (technical > math) and math tilt (math > technical), and contrasts of technical and verbal scores, yielding tech tilt (technical > verbal) and verbal tilt (verbal > technical). Whereas tilt based on technical-math scores contrasts two STEM abilities (technical and math), tilt based on technical-verbal scores contrasts a STEM ability (technical) and a humanities ability (verbal). The distinctiveness of technical-verbal tilt (vs. technical-math tilt) may increase its sensitivity to age and speed differences (cf. Coyle, 2022, 2023b).
In sum, the current study tested the following predictions of magnification, investment, and processing speed theories:
-
The first prediction was that nonlinear (quadratic) effects of age and speed would predict tilt beyond linear effects. Such a prediction is consistent with magnification theories, which assume that in adolescence, age and speed effects cumulate at higher levels of age and speed, magnifying levels of tilt beyond linear effects (Coyle, 2018a, p. 12, 2022, 2023b; Kail, 1991, 2000).
-
The second prediction was that age would moderate speed-tilt relations, with stronger speed-tilt relations at older ages. Such a prediction is consistent investment and speed theories in adolescence (Coyle, 2019, 2020; see also, Coyle, 2022, 2023b; Kail, 1991, 2000). Such theories assume that mental speed facilitates the acquisition of specific abilities (technical and academic) and that increases in mental speed accelerate the acquisition of such abilities, boosting tilt at older ages.
-
The third prediction was that the effects of age and speed on tilt would be independent of g. According to investment and speed theories, the effects of age and speed on tilt should accelerate at higher levels of age and speed due to their cumulative effects on the acquisition of specific abilities (independent of g), magnifying analogous forms of tilt (cf. Coyle, 2018a, p. 12).
Method
Participants
Participants were 6,969 13- to 17-year-olds (3,527 males, 3,442 females). All data were from the 1997 National Longitudinal Survey of Youth (NLSY), a large and representative sample of adolescents in the United States born between 1980 to 1984 (Hering & McClain, 2003, pp. 1–14). Following prior tilt research with the NLSY (e.g., Coyle, 2022, 2023b; see also, Coyle, 2018b; Coyle et al., 2011), the sample included 1,365 13-year-olds, 1,415 14-year-olds, 1,434 15-year-olds, 1,468 16-year-olds, and 1,287 17-year-olds. All participants had scores for all 12 tests of the Armed Services Vocational Aptitude Battery (ASVAB).
Variables
ASVAB tests. Test scores were obtained for 12 ASVAB tests (Hering & McClain, 2003, pp. 82–84; see also, Coyle, 2022, 2023b; Coyle et al., 2011). The tests included two timed speed tests and 10 untimed power tests. The two speed tests were coding speed, which measured the speed of completing a coding chart; and numerical operations, which measured the speed of solving arithmetic problems (mostly involving single digits). The 10 power tests were arithmetic reasoning, which measured the ability to solve math word problems; assembling objects, which measured the ability to infer an object from scattered puzzle pieces; automotive information, which measured knowledge of automobile parts and mechanics; electronics information, which measured knowledge of electricity and electronics; general science, which measured knowledge of organic and inorganic sciences; mechanical comprehension, which measured understanding mechanical principles; math knowledge, which measured the ability to solve math equations; paragraph comprehension, which measured reading comprehension; shop information, which measured knowledge of shop tools and materials; and word knowledge, which measured the ability to identify synonyms.
The power tests were presented on a computer using an adaptive procedure that calibrated item difficulty with ability level. The speed tests were presented on a computer using a non-adaptive procedure with items presented in the same order to all participants. The power tests were scored using item response theory statistics, with higher scores indicating better performance. The speed tests were scored using latencies for correct responses, adjusted for guessing and item presentation time. Prior to analysis, all test scores were standardized in the full sample (M = 0, SD = 1).
ASVAB abilities. The 12 ASVAB tests measured four abilities (speed, math, verbal, technical). Following prior research (e.g., Coyle, 2022, 2023b; see also, Coyle et al., 2011), processing speed was based on the two speed tests: coding speed, in which participants matched numbers with words using a coding key; and numerical operations, in which participants solved simple arithmetic problems, mostly involving single digits (e.g., 5 + 2 = ?). Such tests have been widely used to measure processing speed (e.g., Kail, 1991; Salthouse, 2000). In addition, three other abilities were measured (tests in parentheses): verbal (general science, paragraph comprehension, and word knowledge), math (assembling objects, arithmetic reasoning, and math knowledge), and technical (automobile information, electronics information, mechanical comprehension, and shop information). The four abilities have been validated in latent variable analyses with the ASVAB (e.g., Coyle & Pillow, 2008; Ree & Carretta, 1994; see also, Coyle et al., 2014, 2015; Schmidt, 2011). Each ability was based on the average of a participant’s test scores for the ability.
Tilt scores. Following prior research (e.g., Coyle, 2022, 2023b; see also, Park et al., 2007), tilt scores were computed by standardizing technical and academic (math or verbal) scores in the full sample (M = 1, SD = 0) and taking the difference in technical and academic scores for each participant. Using this procedure, two tilt difference scores were computed: the absolute value of technical minus math scores (|Tech – Math|) and the absolute value of technical minus verbal scores (|Tech – Verbal|). These two difference scores were used to create four additional tilt scores, obtained by splitting each difference score into two non-overlapping subsamples that showed tech tilt or academic tilt. The subsamples included participants showing tech tilt (technical > math) or math tilt (math > technical) based on technical minus math scores; and participants showing tech tilt (technical > verbal) or verbal tilt (verbal > technical) based on technical minus verbal scores. Because tilt scores for each participant were based on the absolute difference in technical minus academic (math or verbal) scores, tilt scores could have values of zero (indicating no tilt) or higher, with higher scores indicating more tilt. All participants showed some degree of tilt (tilt scores > 0) after standardizing test scores in the full sample and computing the absolute difference in technical minus academic (math or verbal) scores for each participant.
g. Following prior research (Coyle, 2022, 2023a; see also, Coyle, 2015; Coyle et al., 2011; Frey & Detterman, 2004; Koenig et al., 2008), general intelligence (g) was based on exploratory factor analysis of the 10 ASVAB power tests and was defined as the first unrotated factor, conventionally labeled g. g factor scores were estimated using principal axis factoring (no rotation) and were obtained for each participant.
Statistical Analyses
Two sets of regressions estimated the effects of age and speed on tilt. Following standard practice (e.g., Cohen et al., 2003, pp. 201–204; see also, Brown et al., 2021; Coyle, 2015), all predictors (age, speed, g) were centered by standardizing the predictors prior to analysis. The first set of regressions examined linear and quadratic effects of age and speed on tilt using multistep regressions. Linear effects were based on the centered scores of age and speed (M = 0, SD = 1). Quadratic effects were based on the square of centered age scores (age2) and the square of centered speed scores (speed2). The regressions analyzed linear effects of age and speed at Step 1, adding quadratic effects at Step 2, and, in supplemental analyses, adding g at Step 3. Because of multicollinearity between age and speed (Appendix C), the effects of age and speed were analyzed simultaneously to estimate their unique effects on tilt.
Key statistics were standardized linear effects of age and speed quadratic effects of age 2) and speed 2), and effects of g Also measured was the change in variance (ΔR2) from Step 1 to 2, and from Step 2 to 3. Based on magnification theories, the regressions were expected to produce linear and quadratic of age and speed on tilt, indicating that tilt levels increased and accelerated at older ages and faster speeds.
The second set of regressions examined main and interactive effects of age and speed on tilt. As before, predictors were centered by standardizing variables prior to analysis. Main effects were based on the centered age and speed scores, and the age × speed interaction was based on the product of the centered variables. (In these analyses, main effects of age and speed, and simple effects of age and speed to follow-up significant age × speed interactions, were linear effects.) The regressions analyzed main effects of age and speed in Step 1, adding the age × speed interaction in Step 2, and, in supplemental analyses, adding g in Step 3. As before, key statistics were standardized main effects of age and speed the age × speed interactions the effects of g Also as before, the regressions measured the change in variance explained (ΔR2) from Step 1 to 2, and from Step 2 to 3. Based on investment and speed theories, speed-tilt relations were expected to increase at older ages. Regressions were performed using IBM SPSS Statistics (Version 29). Appendices A and B report sample SPSS analysis code for the regressions.
Both sets of regressions estimated age and speed effects at each step so that the unique effect of any variable was estimated after controlling for all others. Significant results are reported at p < .05. Unless otherwise noted, all effects are standardized (r and
Results
Preliminary Correlations of Age and Speed With Tilt
Appendix C reports correlations of age and speed (linear and quadratic terms) with absolute tilt difference scores, tech tilt scores, and academic tilt scores (math tilt and verbal tilt). Absolute tilt difference scores were based on differences (|technical minus academic|) in technical and academic scores (math or verbal). Tech tilt scores were from participants with higher technical than academic abilities (technical > academic). Academic tilt scores were from participants with higher academic than technical abilities (academic > technical). All tilt scores were scaled so that higher scores indicated more tilt.
The correlations supported investment and speed theories of tilt (Appendix C). (Unless otherwise noted, age and speed relations indicate linear relations with other variables.) First, consistent with speed theories, age correlated positively with speed (r = .29), indicating that speed increased at older ages. Second, consistent with investment theories, age correlated positively with absolute tilt difference scores (r = .11) and with tilt scores for subsamples showing tech tilt or academic tilt (r = .09 to .13), indicating that tilt increased with age.[1] Third, speed correlated positively with academic tilt (r = .22 to .29) and negatively with tech tilt (r = -.20 to -.12). The negative relations indicate that tech tilt was associated with lower ability levels (indexed by speed), indicating that the higher tech tilt levels were associated with slower speeds. Fourth, age and speed correlated negligibly with their quadratic complements (r = .01 to .04), and with the age × speed interaction term (r = .01 to .11). The negligible relations of age and speed with the product terms 2, 2, indicate little multicollinearity between the product terms and their components, which eases interpretation of effects (Cohen et al., 2003). Finally, g correlated positively with age (r = .29) and speed (r = .64) and with all tilt variables (r = .06 to .27), indicating that increases in g were associated with higher levels of age, speed, and tilt.
Linear and Quadratic (Nonlinear) Effects of Age and Speed on Tilt
Two-step regressions analyzed linear (Step 1) and quadratic effects (Step 2) of age and speed on tilt. Key statistics include standardized effects of age and speed at each step s) and the change in model variance explained from Step 1 to Step 2 (ΔR2). Consistent with magnification theories, the key prediction was that quadratic effects of age and speed in Step 2 would predict tilt beyond linear effects of age and speed in Step 1.
Table 1 reports the results for tilt difference scores based on the absolute value of technical minus academic (math or verbal) scores. There were two tilt difference scores: |technical minus math| (Analysis 1) and |technical minus verbal| (Analysis 2), with higher values indicating more tilt. Linear effects of age on the absolute value of the tilt difference scores were significant at Step 1 = .11 to .12), indicating that tilt increased with age, a pattern consistent with investment theories. In contrast, linear effects of speed on the tilt difference scores were not significant at Step 1 = -.02 to -.01). Quadratic effects of age = -.03 to -.02) and speed = .07 and .15) on tilt difference scores were significant at Step 2 but the variance explained was trivial (ΔR2 = .005 to .023). The results indicate that tilt primarily increased linearly with age, with negligible quadratic effects. The next set of analyses examined the effects of age and speed on tilt for subsamples showing tech tilt or academic tilt (math tilt or verbal tilt).
Table 1 also reports the results for subsamples showing tech tilt (technical > academic), based on technical minus math scores (Analysis 3) and technical minus verbal scores (Analysis 4). (The results for both measures of tech tilt were similar in sign and magnitude and therefore are averaged below.) Linear effects of age on tech tilt were positive at Step 1 s = .18), indicating that tech tilt increased with age, a pattern consistent with investment theories. Conversely (and consistent with prior research), linear effects of speed on tech tilt were negative at Step 1 = -.25 to -.17), indicating that slower speeds were associated with more tech tilt. Contrary to magnification theories, quadratic effects of age s = -.01) and speed = -.02 to -.01) on tech tilt were non-significant and negligible at Step 2. Moreover, the change in variance explained after adding the quadratic effects in Step 2 was trivial (ΔR2 < .001), indicating no magnification of tech tilt at higher levels of age or speed.
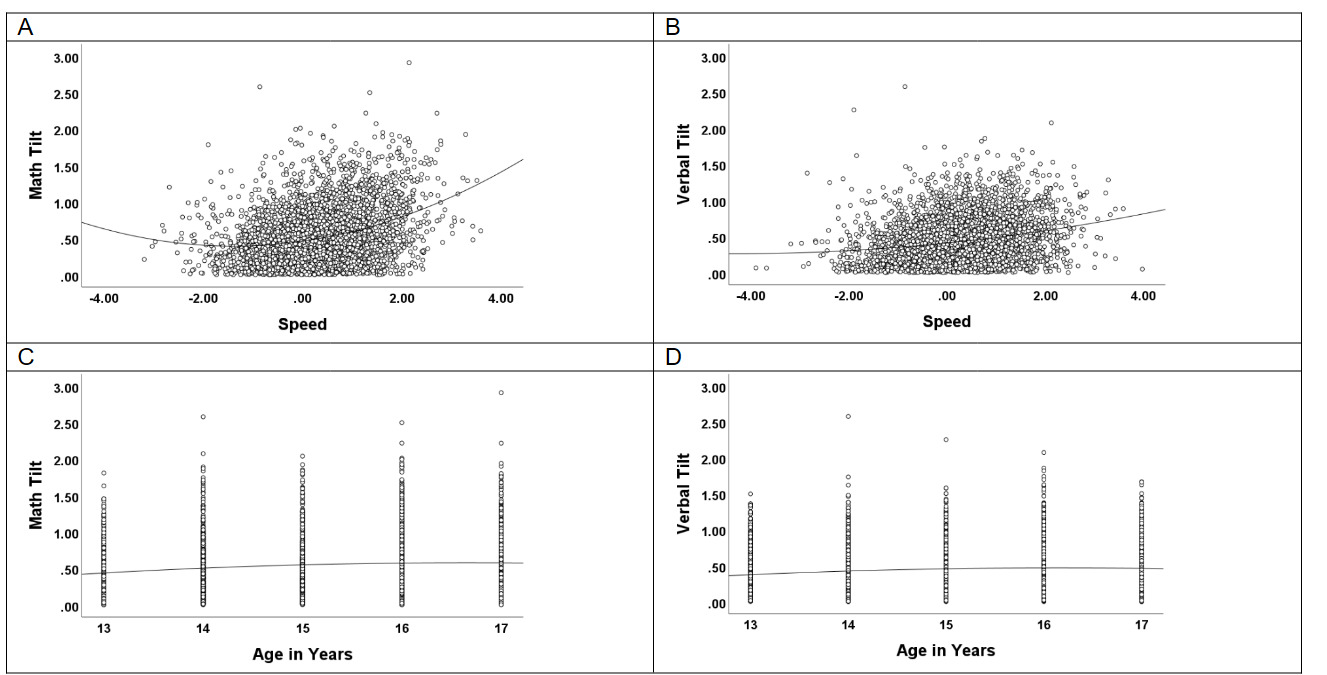
Table 1 also reports the results for subsamples showing academic tilt (academic > technical), which included math tilt (math > technical) based on technical minus math scores (Analysis 5) and verbal tilt (verbal > technical) based on technical minus verbal scores (Analysis 6). (As noted, math and verbal tilt scores were based on their absolute value so that higher scores indicated more tilt.) Contrary to investment theories, linear effects of age on math and verbal tilt were negligible and nonsignificant at Step 1 = .02 to .03). In contrast, linear effects of speed on math and verbal tilt were positive and significant = .21 to .28), indicating that academic tilt increased at faster speeds, a pattern consistent with speed theories. Consistent with magnification theories, quadratic effects of speed 2) on math and verbal tilt were positive and significant at Step 2 = .04 to .13), indicating that levels of academic tilt were magnified at faster speeds (Fig. 1, Panels A and B). In contrast, quadratic effects of age 2) on math and verbal tilt were negative and trivial in size = -.04 to -.03), indicating that levels of academic tilt showed a slight accelerated decline at older ages (Fig. 1, Panels C and D). The negative quadratic effects of age were unexpected (albeit trivial in size) and will be revisited in the Discussion. The change in variance explained after adding the quadratic effects in Step 2 was trivial (ΔR2 = .003 to .015).
_and_verbal_tilt_(b)__and_negative_qua.png)
Does Age Moderate Speed-Tilt Relations?
The analyses reported in this section examined whether age moderated speed-tilt relations, with moderation based on the product term of age and speed (with no quadratic terms). These analyses differed from the prior analyses of nonlinear effects (yielding trivial quadratic effects) and examined whether tilt was moderated by age and speed. The analyses were motivated by speed and investment theories, which assume that speed facilitates the acquisition of specific abilities (technical and academic) and that increases in mental speed accelerate the acquisition of such abilities, boosting tilt at older ages.
To examine moderation, two-step regressions analyzed the main effects of age and speed in Step 1 and their interaction in Step 2. Key statistics included the standardized effects of age and speed at each step s) and the change in model variance explained from Step 1 to Step 2 (ΔR2) (Table 2, Analyses 1 to 6). Consistent with speed and investment theories, the key prediction was that age would moderate speed-tilt relations and that speed-tilt relations would strengthen at older ages.
Table 2 reports the results of the regressions, which estimated main effects of age and speed in Step 1, and age × speed interactions in Step 2. Tilt measures included the absolute value of tilt difference scores (Analyses 1-2) and subsamples showing tech tilt (Analyses 3-4), math tilt (Analysis 5), and verbal tilt (Analysis 6). Consistent with investment theories, the main effects of age on tilt difference scores = .11 to .12) and tech tilt scores s = .18) were positive at Step 1, indicating that tilt scores increased with age. In contrast, the main effects of speed on tech tilt were negative and significant in Step 1 = -.25 to -.17), indicating that tech tilt levels decreased at faster speeds. Consistent with speed and investment theories, the main effects of speed on academic tilt (math tilt and verbal tilt) were positive and significant in Step 1 = .21 to .28), indicating that math and verbal tilt increased at faster speeds. Finally, the age × speed interaction was significant (albeit trivial in size) for math tilt but not for any other type of tilt, with speed-math tilt relations increasing at older ages (rs = .14, .27, .25, .30, .32 for 13- to 17-year-olds, respectively).
Supplemental Regressions of the Effects of g
The aim of the current study was to examine the magnification of tilt at higher levels of age and speed. However, because of multicollinearity of age, speed, and tilt with g (Appendix C, column 12), the prior effects of age and speed on tilt might be attributed to g. To examine this possibility, supplemental regressions examined whether the prior linear, nonlinear, and interactive effects of age and speed on tilt persisted after accounting for g.
Tables 3 and 4 report supplemental regressions of the incremental effects of g (in a new Step 3) beyond the prior linear and quadratic effects of age and speed at Step 2 (cf. Table 1), and beyond the prior main and interactive effects of age and speed at Step 2 (cf. Table 2). Steps 1 and 2 of the supplemental regressions were identical to the prior regressions. However, in a new Step 3, g was added to the linear and quadratic effects of age and speed (Table 3), or to the main and interactive effects of age and speed (Table 4). The R2 change statistic (ΔR2) from Step 2 to 3 measured the incremental effects of g beyond linear or quadratic effects of age and speed, or beyond main and interactive effects of age and speed. To simplify presentation, Tables 3 and 4 report only effects in Step 3, including standardized effects s) and the R2 change from Step 2 to 3 after adding g in Step 3. As before, three types of tilt were analyzed: absolute tilt difference scores (technical minus math, technical minus verbal), tech tilt (technical > academic), and academic tilt, which included math tilt (math > technical) and verbal tilt (verbal > technical).
The current regressions included g in Step 3 (Tables 3 and 4) and replicated the age and speed effects in the prior regressions that omitted g (cf. Tables 1 and 2), with exceptions noted below. (Unless otherwise noted, the pattern of effects in the current regressions including g and the prior regressions omitting g were identical.) First, after including g in the new Step 3, age relations with tilt were still positive and significant for the absolute tilt difference scores = .08 to .10) and tech tilt scores = .14 to .15), and still trivial for academic tilt = -.01 to .03), with trivial differences in analogous effects for the current analyses including g in Step 3 and the prior analyses omitting g in Step 2 (M difference = .02). The positive relations of age with tilt indicate that levels of tech tilt (but not academic tilt) increased with age. Second, after including g in Step 3, speed relations with tilt increased in absolute magnitude from Step 2 and were still negative for the absolute tilt difference scores = -.13 to -.11) and tech tilt = -.43 to -.28), and still positive for academic tilt = .06 to .28), with moderate differences in analogous effects for the current analyses including g in Step 3 and the prior analyses omitting g in Step 2 (M difference = .10). The increases in speed relations with tilt after including g in Step 3 indicate that g was acting as a suppressor variable (Tzelgov & Henik, 1991), increasing speed relations with tilt. Finally, quadratic effects of age and speed on tilt 2 and 2), and interactions of age and speed on tilt were nearly identical in the prior analyses omitting g in Step 2 (cf. Tables 1 and 2) and the current analyses including g in Step 3 (Tables 3 and 4) (M difference = -.01), suggesting that g had no appreciable impact on the quadratic or interactive effects of age and speed.
Discussion
This study examined nonlinear and interactive effects of age and speed on tilt, defined as within subject differences in technical and academic abilities (math or verbal) measured on the ASVAB. The differences produced tech tilt (technical > academic), indicating strength in technical abilities (relative to academic abilities) and academic tilt (academic > technical), indicating strength in academic abilities (relative to technical abilities). Prior research has supported investment theories of tilt, showing that tilt increases with age-related investment in specific domains (e.g., technical or academic) (Coyle, 2018a; Coyle & Greiff, 2021, 2023). Prior research has also supported processing speed theories, showing that tilt increases with mental speed as faster speeds boost the acquisition of specific abilities that produce tilt (Coyle, 2022, 2023b; Kail, 1991, 2000).
The current study was the first to test the predictions of magnification theories (Coyle, 2018a, p. 12). Such theories predict that tilt levels are magnified at higher levels of age and speed, as the effects of age and speed cumulate. The cumulative effects of age and speed are assumed to boost tilt beyond linear effects, producing positive quadratic effects. The current study was also the first to test moderation effects of age and speed on tilt. Such effects are predicted by investment and speed theories (Coyle, 2019, 2020; see also, Coyle, 2022, 2023b; Kail, 1991, 2000). These theories assume that age-related increases in speed in adolescence accelerate the acquisition of specific abilities, boosting analogous forms of tilt and strengthening speed-tilt relations at older ages.
The linear effects of age and speed supported investment and speed theories of tilt (Coyle, 2019, 2020, 2022, 2023b; Kail, 1991, 2000). (In Tables 2 and 4, main effects of age and speed were linear effects and therefore, for brevity, are described here as linear effects.) First, linear effects of age on tech tilt were positive (Tables 1 to 4; see also Appendix C), suggesting that tech tilt increased with age-related investment in technical domains, a pattern consistent with investment theories. Second, linear effects of speed on academic tilt were also positive (Tables 1 to 4), suggesting that faster speeds boosted the acquisition of academic tilt, a pattern consistent with processing speed theories. Finally, linear effects of speed on tech tilt were negative (Tables 1 to 4), suggesting that tech tilt was associated with lower ability levels (indexed here by speed). The negative effects of speed on tech tilt suggest that people with lower ability levels gravitate toward technical (vs. academic) activities, producing tech tilt (Wilk et al., 1995; see also, Bouchard, 1997; Johnson, 2010; Scarr & McCartney, 1983). The linear effects of age and speed persisted after accounting for quadratic effects 2 and 2, Table 1), moderation effects (age × speed interaction; Table 2), and g (Tables 3 and 4), suggesting that the linear effects were robust and were independent of g.
The pattern of linear effects supports investment theories (Cattell, 1987, pp. 138–146; see also, Coyle & Greiff, 2021, 2023; von Stumm & Ackerman, 2013) and experience producing drive theories (Bouchard, 1997; see also, Johnson, 2010; Scarr & McCartney, 1983). Such theories assume that vocational interests produce differential investment across domains (e.g., STEM vs. humanities), increasing engagement in specific domains and producing analogous forms of tilt. If differential investment (rather than g) drives tilt, tilt levels should increase at older ages or faster speeds, which boost specific abilities that produce tilt.
Contrary to magnification theories, nonlinear (quadratic) effects of age and speed on tech tilt and academic tilt were generally negligible = -.04 to .13; Tables 1 and 3, Analyses 3 to 6), as were interactive effects of age and speed on both types of tilt = -.01 to .05; Table 2 and 4, Analyses 3 to 6), with the variance explained being negligible (ΔR2 = .001 to .015; Tables 1 and 2, Analyses 3 to 6). With exceptions noted below, the negligible nonlinear and interactive effects of age and speed contradict magnification theories. Such theories assume that tilt levels are magnified at higher levels of age and speed, producing nonlinear or moderation effects. The trivial nonlinear and interactive effects, coupled with the robust linear effects, suggest that the effects of age and speed on tilt are primarily linear and additive (rather than nonlinear and multiplicative), increasing at the same rate across all levels of age and speed.
Although nonlinear effects of speed and age contributed negligibly to tilt, two sets of quadratic effects for academic tilt were significant but trivial in size. First, quadratic effects of speed 2) on academic tilt (i.e., math tilt and verbal tilt) were positive (Tables 1 and 3, Analyses 5 and 6), indicating that tilt levels were magnified at faster speeds (Fig. 1, Panels A and B).[2] The positive effects suggest that faster speeds accelerated the acquisition of academic abilities (producing academic tilt), a pattern consistent with magnification theories (Coyle, 2018a, p. 12). In contrast to the effects for academic tilt, no quadratic effects of speed on tech tilt were observed (Tables 1 and 3, Analyses 3 and 4). The difference in effects might be attributed to differential exposure to technical (e.g., electronics and mechanics) and academic (e.g., math and verbal) activities in middle and high school, the grade levels in adolescence. Because schools provide extensive exposure to academic activities, faster mental speed can accelerate the acquisition of such abilities, magnifying academic tilt. In contrast, because schools provide limited exposure to technical activities, faster mental speed would not be expected to magnify technical abilities, which are typically ignored in school and have limited opportunity for development in school. Future research should examine tech tilt in college and later, when people have more autonomy to invest in domains compatible with their vocational interests (cf. Bouchard, 1997; see also, Scarr & McCartney, 1983). If vocational interests produce differential investment in technical (vs. academic) domains, then such interests may magnify tech tilt later in life, when people with technical interests have more opportunities to select technical activities that produce tech tilt.
Second, quadratic effects of age 2) on academic tilt (math tilt and verbal tilt) were small but negative (Tables 1 and 3, Analyses 5 and 6), indicating that academic tilt declined at an accelerated pace at older ages. This decline may be related to decreases in age-related investment (i.e., time and effort) in specific domains or decreases in the effect of vocational interests on such investment, producing the negative quadratic effects of age. The quadratic effects may also be related to age dedifferentiation from middle to late adolescence. Age dedifferentiation refers to a decrease in the influence of specific abilities, coupled with an increase in g, on cognitive tests. Such a pattern may result from changes in variance attributable to g-loaded domain-general factors (e.g., working memory) in adolescence (cf. Skalaban et al., 2022). This hypothesis could be tested by examining quadratic effects of age on academic tilt before and after controlling for domain general factors such as working memory. If quadratic effects of age are influenced by such factors, then controlling for them should neutralize the effects.
Although the quadratic effects of age on academic tilt were significant, they were trivial in size = -.04 to -.03, Tables 1 and 3) and were coupled with trivial linear effects of age on academic tilt = -.01 to .03, Tables 1 and 3) and with relatively large positive linear effects of speed on academic tilt = .06 to .22, Tables 1 and 3). The trivial size of the quadratic and linear effects of age on academic tilt may be attributable to speed, a hypothesis consistent with age-based speed theories (see also, Coyle, 2022, 2023b; Kail, 1991, 2000). Consistent with this hypothesis, age was significantly (and positively) related to academic tilt before controlling for speed (r = .09 to .13, Appendix C) but not after controlling for speed = .02 to .03, Tables 1 and 3), suggesting that age effects on tilt were attributable to speed. The negligible age effects (after controlling for speed) are consistent with research indicating that speed mediates age-academic tilt relations (e.g., Coyle, 2023b, his Table 4; see also, Fry & Hale, 1996; Tourva & Spanoudis, 2020). Together, such findings suggest that speed largely explains increases in academic tilt in the age range sampled (13- to 17-years) and that after accounting for speed, linear or quadratic effects of age have negligible effects on academic tilt.
The current results extend prior research examining relations among g and tilt, which indicates that g has trivial nonlinear effects (but robust linear effects) on tech tilt and academic tilt (e.g., Coyle, 2025; see also, Coyle, 2022, 2023b). Together, the current and prior results indicate that the effects of g, age, and speed on tilt are generally additive rather than multiplicative, with tilt increasing at the same rate across all variables, at least in adolescence (i.e., 13- to 17-years). Future research might examine linear and quadratic effects of age, speed, and g in adulthood (i.e., 20- to 80-years). Different theories make different predictions about tilt in adulthood. Investment theories assume that differential investment accumulates over the lifespan, boosting tilt levels as people seek out activities compatible with their interests (Cattell, 1987, pp. 138–146; see also, Coyle, 2018a; Coyle & Greiff, 2021, 2023; von Stumm & Ackerman, 2013). In contrast, dedifferentiation theories predict increases in g, and decreases in the influence of specific abilities, over the lifespan (Blum & Holling, 2017; see also, Breit et al., 2021, 2022; Tucker-Drob, 2009). Because tilt is based on contrasts of two specific abilities (e.g., technical and academic), a reduction in the distinctiveness of specific abilities over the lifespan may reduce the effects of age on tilt.
Like the quadratic effects of age and speed, the age × speed interactions for tech tilt and academic tilt were also trivial = -.01 to .05, Tables 2 and 4, Analyses 3 to 6), with the variance explained being negligible (ΔR2 = .001 to .002, Table 2, Analyses 3 to 6). An exception was the significant but trivial age × speed interaction for math tilt = .05, Tables 2 and 4, Analysis 6), indicating that speed-math tilt relations increased at older ages. This pattern supports speed theories of adolescence (Coyle, 2022, 2023b; see also, Kail, 1991, 2000). Such theories assume that speed increases with age and that faster speeds facilitate the acquisition of specific abilities (e.g., technical or academic) that produce tilt. The fact that the age × speed interaction was observed for math tilt (but not verbal tilt) may be attributed to the effects of speed on unique math strategies, facilitating the acquisition of such strategies at older ages and producing stronger speed-math tilt relations. Future research should examine the contribution of specific math strategies to tilt and whether faster speeds facilitate the acquisition of such strategies at older ages.
Future research should consider the causes and consequences of changes in processing speed. One possibility is that in childhood, increases in processing speed accelerate the encoding, storage, and retrieval of knowledge and skills in specific domains (e.g., technical or humanities), producing complementary forms of expertise and tilt (e.g., tech tilt or verbal tilt) (cf. Meier et al., 2023). Another possibility concerns cognitive training interventions to improve processing speed and other cognitive abilities (e.g., working memory). Such interventions do not boost g in well-powered, randomized controlled trials (e.g., Redick et al., 2013; see also, Melby-Lervåg et al., 2016). However, the same interventions (notably those targeting processing speed) may accelerate the acquisition of specific non-g factors and skills in narrow domains, boosting complementary forms of tilt. A final possibility concerns the generalized declines in processing speed over the lifespan (e.g., 20- to 80-years). Such declines may adversely affect all cognitive processes (e.g., encoding, storage, and retrieval) and abilities, accounting for age-related changes in g (cf. Salthouse, 1996; see also, Coyle et al., 2011; Kail & Salthouse, 1994).
Conclusion
The current study was the first to examine quadratic and interactive effects of age and speed on tilt. Tilt was based on differences in technical and academic (math or verbal) scores, yielding tech tilt (technical > academic) and academic tilt (academic > technical). Tilt was examined as a function of age and speed in adolescence (13- to 17-years). In general, quadratic and interactive effects of age and speed on tilt were negligible (explaining less than 1% of variance in tilt), and linear effects of age and speed on tilt were robust. Together, the results indicate that the effects of age and speed were additive (rather than multiplicative) and that tilt levels increased at the same rate across all levels of age and speed. Exceptions to the overall pattern included quadratic effects of speed on academic tilt (math tilt and verbal tilt), indicating that academic tilt was magnified at faster speeds, and interaction effects of age and speed on math tilt, indicating that speed-tilt relations increased at older ages. The effects support magnification and speed theories, which assume that faster speeds accelerate the acquisition of academic tilt at older ages. No multiplicative effects were found for tech tilt, which is based on technical activities that are typically ignored in school, providing limited opportunities for development. Future research might examine quadratic and interactive effects of age and speed on tilt over the lifespan (20- to 80-years), when increases in g may inhibit the expression of specific abilities, producing accelerated declines in tilt.
Author Note
The author was supported by the National Science Foundation’s Interdisciplinary Behavioral and Social Science Research Competition (IBSS-L 1620457); the U.S. Department of Defense through the Congressionally Directed Medical Research Program (HT9425-24-1-1000); and a Faculty Development Leave from the University of Texas at San Antonio.