

Introduction
Strong claims that effort is a major cause of differences in cognitive ability scores (Duckworth et al., 2011) have recently been cast in doubt (Duckworth et al., 2025), and, now, retracted (“Retraction for Duckworth et al., Role of Test Motivation in Intelligence Testing,” 2025). The authors note in this retraction notice that “Adjusting for publication bias using trim-and-fill reduces the estimated effect size to a more plausible effect size (g = 0.16) but now, with this reduced sample size, the confidence interval for the publication-bias-adjusted estimate includes zero (i.e., the publication-bias-corrected estimate no longer achieves statistical significance”. The claim that effort raises ability scores has substantial implications for theories of ability and motivation , and, importantly, for educational policy and the validity of cognitive testing (Bates & Gignac, 2022; Inzlicht et al., 2021; Warne, 2022). The purpose of the present paper was to resolve the question of whether effort exerts any causal influence on cognitive ability scores. We do so by using an instrumental variable approach, allowing randomized controlled causal test of effects of effort on ability, with effects of effort assessed directly terms of changes in effort, and replicating this causal design in two large-scale tests of effort manipulated via incentives. We first background the literature.
Test-taking effort is typically operationalised in scales such as the Student Opinion Scale (SOS: Sundre & Thelk, 2007), e.g., ‘I engaged in good effort throughout these tests’. In observational studies, such post-test measures of effort correlate around .28 with test scores (Silm et al., 2020). This sets an upper bound on the causal effect of effort (Bates & Gignac, 2022), but is confounded by feelings of efficacy developed during task performance. This confound is important, because self-appraisal very strongly reflects objective performance (Hart & Staveland, 1988), i.e., “good effort” essentially means “expecting a good score”.
A meta-analysis of studies manipulating small monetary incentives concluded effort lifts test scores by a very large 0.64 SDs (Duckworth et al., 2011) – an exceptional effect in social research and over double the limit set by the cross-sectional association.
However, the studies included in this meta-analysis suffered from significant limitations, including low statistical power and compromised designs. Critically, some of the largest effect sizes were from fraudulent research that was later retracted (Warne, 2022). Recognizing these issues, the meta-analysis authors themselves issued a note of concern, acknowledging that withdrawing this dubious data greatly shrinks the overall effect (Duckworth et al., 2025).
Recent large within-subjects repeat-measures randomised control tests of monetary incentive effects have yielded much smaller effects (d = .17) and no evidence of dose dependency (Bates & Gignac, 2022). However most or even all this modest association of effort with cognitive performance may reflect reverse causation. Note, reverse causation occurs when participants infer their level of effort from their perceived success, leading higher cognitive performance to cause reports of greater effort, rather than the other way around. Contrarily, it is possible in existing designs to suggest that small apparent effects of effort in fact mask strong effects of effort due to weak coupling of the incentive to effort. This can be remedied by an instrumental modelling approach, which distinguishes between the effect of the randomized instrument on the proposed causal variable and the effect of this causal variable on the outcome, allowing the effect to be measured in units of the variable of interest. The instrumental variable method is explained in more detail in Study 2 (see also Fig 2). Very briefly, this method enables causal analysis of the effects of variables such as effort which the researcher cannot directly vary, but instead are varied indirectly by an instrument (in this using incentive as an instrument to manipulate effort (Bates & Gignac, 2022; Duckworth et al., 2011).
Current data, then, are compatible with one or more of a) effort causally increases cognitive ability; b) cognitive ability increases effort (i.e., a rational choice to invest); and c) complete reverse causation. Note, reverse causation occurs when higher cognitive performance leads participants to report greater effort, as they infer effort from their perceived success, rather than effort causing better performance.
What is needed to test the prediction that effort does not causally raise cognitive ability is a method capable of isolating causal effects of effort on cognitive performance. Doing this requires 1) A statistically significant experimental manipulation of effort via incentive; 2) Randomized allocation of subjects to this incentive; 3) A prospective measure of effort on the cognitive task; and 4) Modelling effects of effort in a way capable of estimating the causal effect of effort on scores (Sanderson et al., 2022). We do this in Study 2 with a pre-test measure of effort, analysing the “effort score” causal path within an instrumental variable design not susceptible to confounding. We begin by validating a prospective measure of effort (study 1). Study 2 tests the causal effect of effort in a large study, and Study 3 replicates study 2 using larger N, pre-registered analysis, and an independent measure of effort.
Study 1
The conventional framework for effort research is task motivation theory. Task motivation is understood as task value × expectancy of success (Eccles et al., 1983; Eccles & Wigfield, 2023). In this formulation, increased task value can increase effort, contingent on prospects of success. Goal setting theory (Locke & Latham, 2002) further predicts that after completion of a motivated task, subjects evaluate their performance, using this to update self-efficacy. Therefore incentive can increase effort, but self-efficacy may increase effort (investment), and, moreover, if effort is measured after performance, reports of effort are contaminated by subjective awareness of performance, often to very substantial degree (Dong et al., 2013).
Awareness of problems with post-task reports of effort has lead motivation researchers to suggest that it is critical to use pre-task measures of effort in order to avoid confounding (Weiner, 2000). Thus both theory and practice imply that to maximise validity and avoid confounding, effort should be measured prospectively (Myers & Finney, 2019). Despite this most research has used measured effort post-test. This is a critical distinction, as the gap between confounded correlational findings and causally-identified effects can be stark. For instance, while observational studies of financial literacy report a correlation of around β = .15 with financial behavior, large-scale causal interventions often find zero effect (Fernandes et al., 2014). Prospective measures of effort, then, are recommended, and can avoid confounding of subjective attributions with information about performance and allows us to randomly vary incentives and resolve the resulting unambiguous measures using instrumental variable models to estimate the causal effects of effort.
A large body of work suggests that assessing effort prior to performance can remove the confound of post-hoc performance evaluation while retaining validity. The validity of effort measures both prior to and during testing has been compared. In a large representative sample of German ninth-graders (Penk & Schipolowski, 2015) found that a pre-test and post-test assessment correlated highly. Moreover, disclosure of intended effort induces commitment (Carver & Scheier, 1998), and increases test performance (Myers & Finney, 2019), increasing the efficacy of effort. Pre-test effort measures, then, avoid confounds while retaining validity. Jointly, this information implies that, to avoid potential confounding, effort can and should be measured prospectively (Penk & Richter, 2017) to protect against mistaken models of causation (Myers & Finney, 2019).
We set out, therefore, to validate a prospective effort scale which correlated strongly with the post-test Student Opinion Scale (SOS: Sundre & Thelk, 2007) – the most widely validated and used instrument (Silm et al., 2020). The SOS is completed after cognitive testing and has separate scales the importance with which the subject views their score and the effort they exerted. As noted by Myers and Finney (2019), the SOS lends itself straightforwardly to translation into a prospective measure. For study 1, therefore, we built a pre-test version of the SOS re-wording items to measure prospective effort.
We had four predictions. First, we predicted that pre-test SOS would correlate very strongly with post-test SOS, showing face validity of the new instrument. Second, we predicted that the pre-test SOS would show external validity, correlating with ratings of satisfactory performance as a subject, and number of projects completed on prolific (our subject recruitment service). Third we assumed that pre-test SOS would correlate significantly with cognitive ability scores, and at around the level shown for the SOS. Fourth, in-line with the confounding hypothesis, we predicted that, controlling for post-test score, pre-test effort would fail to predict cognitive score as post-test score could control for effort. Study 1 hypotheses, methods, and participant numbers were pre-registered (aspredicted.org #103900).
Method
Subjects
Subjects were recruited from Prolific Academic, a high quality online service for recruiting participants and payment handling for participation (Douglas et al., 2023). We recruited 393 adult subjects (age M = 44.45, SD = 13.83, 198 male and 195 female. Ethics approval was granted by the University of Edinburgh Psychology ethics committee (#4-2122/2).
Materials
Post-test effort was assessed using the SOS. An example item is “I gave my best effort on these tests.”. Subjects respond on a 5-point Likert scale with anchors from ‘Strongly Disagree’ to ‘Strongly Agree’. ω-t in our sample was 0.72. Note, only the effort scale was scored and used here, but to preserve the normal format for this test, all 10 items of the SOS were administered, i.e., including items assessing how important the tests were to the participant.
Pre-test effort was measured by modifying the item tense of the SOS items. Effort items were:
-
I will engage in good effort throughout this test.
-
I will give my best effort on this test.
-
If I had to, I likely could work harder this test than I will. (R)
-
I will not give this test my full attention while completing it. (R)
-
I will persist to completion of this test.
This scale proved reliable in the present sample (Omega-t (ω-t) = 0.78).
The response range of the pre-test effort items was extended from 1-5 to a 1-7 to increase precision. Anchors were 1: “Disagree Strongly” to 7: “Agree Strongly”). ω-t reliability was 0.78. As for the SOS, modified importance items administered but are not analysed.
Cognitive ability was assessed using the 32-item Form B of the Baddeley (1968) sentence verification test. Items require grammatical transformation to evaluate the truth of a simple sentence, e.g. “A does not follow B: AB” (TRUE). Subjects had 90 seconds to complete as many items as possible. Coefficient ω in our sample was 0.91.
Procedure
Testing took place online using the Prolific academic and Qualtrics platforms. Testing took around 5 minutes. After providing informed consent, subjects completed the pre-test effort scale, followed by the first ability test followed by the SOS measure of effort and the rating of test-difficulty. Finally, subjects estimated the difficulty of the cognitive test items on a 5-option scale from “very easy” to “very difficult”. As part of pilot collection for research on alternative measurement formats this was followed by 3 slider-response items asking subjects to specify their motivation, intended effort and attention (not analysed here).
Results
All analyses were conducted in R (R Development Core Team, 2024) and umx (Bates et al., 2019). Descriptive statistics are given in Table 1.
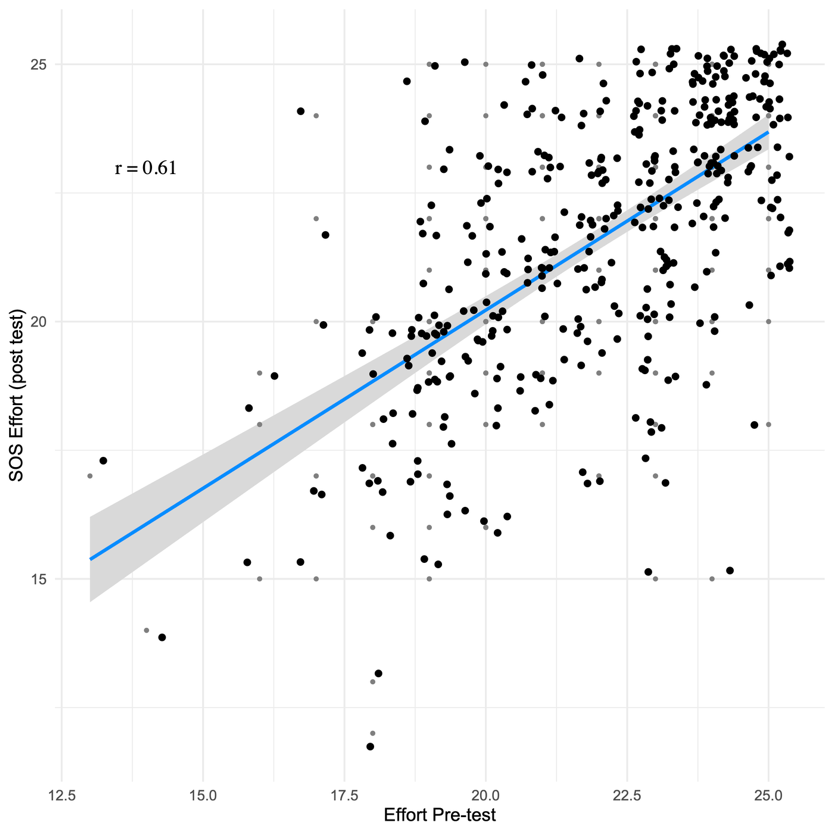
The prediction that pre-test SOS would correlate very strongly with post-test SOS was tested by regressing pre-test effort on post-test SOS effort. This revealed a strong relationship between the two measures (β = .61 [0.531, 0.688], t = 15.25, p < 0.001), showing excellent convergent validity of the new instrument (see Fig 1). We bolstered this by using the pre-test effort measure to predict two independent quality measures available from Prolific academic: Subject quality score (number of strikes against test-taker in earlier participations) and number of approvals of participation. Both were significantly associated with our new effort measure (β = .16 [0.06, 0.26], t = 3.24, p = .001 and β = .14 [.05, .24], t = 2.87, p = .004 respectively). This real-world effort supports the external validity of the new instrument.

We had assumed that pre-test SOS would correlate significantly with cognitive ability scores. Strikingly, and in contrast to the post-test measure, a regression predicting cognitive score from pre-test effort was not statistically significant (β = .03 [-0.07, 0.13], t = .64, p = .524). Controlling for age and sex made no material difference. By contrast, in the same data, and despite the strong correlation of the pre and post effort measures, the post-test SOS measure was significantly related to test score (β = .24 [0.14, 0.33], t = 4.86, p < 0.001). These last two results are, perhaps, a harbinger of a lack of causal effect of effort on cognitive ability test performance.
Discussion
Four findings were of interest. The pre-completion effort measure was reliable and correlated strongly with SOS post-test effort (r = .61). The pre-test measure of effort was also validated by independent objective indicators of effort in the form of data quality and an independent measure of workload (r = .14 & .16). Finally, the pre-test measure of effort correlated with cognitive scores only weakly and non-significantly, compared to the confounded measure of effort recorded after the subjects had completed the task.
This non-significant correlation suggests that the prospective effort measure, unlike post-test scales, may be free from performance-driven confounds, hinting at a potential lack of causal influence of effort on scores. We next moved to study 2, where SOSpre could be used to test the causal effect of effort on cognitive score in an instrumental variable framework targeting the question of causation for effort increasing cognitive scores.
Study Two
Having developed the prospective effort measure in study 1, in study 2 we use it to test the causal effect of effort on cognitive score. We begin by briefly introducing the instrumental variables framework, within which RCTs exist as a conceptual subset (Sanderson et al., 2022).
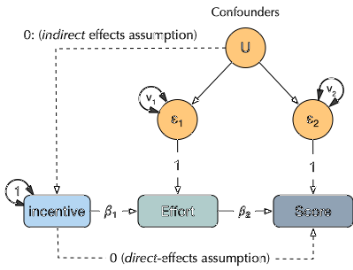
Because effort cannot be directly varied, researchers rely on manipulating effort by varying incentive (Bates & Gignac, 2022; Duckworth et al., 2011). However, the key independent variable of interest is effort, not incentive, as it is effort which is proposed to exert a causal effect on cognitive ability. This problem of manipulating an inaccessible parameter via a variable under control of the researcher is a common one, and the best-developed approach is the Instrumental Variable (IV) framework – a class of statistical model estimating the causal effect of a putative causal variable (in our case effort) on an outcome (in our case ability score), using a third “instrumental” variable (in our case incentive) to perturb the causal variable at random with respect to confounders (Wright, 1928). This approach is drawn as a path model testing causality in Fig 2.

As can be seen (Fig 2), the instrumental variable affects the putative causal variable but 1) must have no direct effect on the outcome, and 2) is not under control of any of the confounders (which in this case is assured because the incentive is set at random by the researchers). By using the instrumental variable, researchers can estimate the effect of the independent variable on the dependent variable, in units of the causal variable, and while still modelling unmeasured confounders (U). These properties make it an attractive and widely deployed design.
A key strength of the IV design is its ability to detect a large underlying causal effect even if the instrument (incentive) has only a modest impact on the causal variable (effort). Therefore, if effort does causally improve scores as claimed by Duckworth et al. (2011, p. 7717) the estimated effect of effort on performance (𝛽2 in Fig 2) can be large.
Here, we manipulate effort with a £2 incentive to improve scores by 1 item or more correct compared to an initial baseline. If the design is valid, then subjects in the incentive condition will show higher effort scores (i.e., significant 𝛽1, validating the incentive). The effort theory of cognitive ability predicts that effort will have a significant and substantial effect on cognitive score (i.e., significant 𝛽2). Based on funding, we ran 500 subjects.
Method
Sample
Five hundred adult subjects (age M = 39.5, SD = 13.25) were recruited on Prolific Academic (248 male and 252 female). The sample was predominantly white (Asian 23; Black 17; Other 8; Southeast Asian 2; White 450). Subjects were paid £1.35 for their participation (excluding £2 bonus).
Materials
Intelligence was measured using parallel forms of the Visual Paper Folding test (Ekstrom et al., 1976). Each form included 10-items completed with a 3-minute time limit and the forms are designed to be equally difficult. For further details, see Study 1. For the total sample, reliability (ω-t) was estimated at .73 and .67 for Forms A and B respectively. Effort was measured using the pre-test measure of effort developed in Study 1. Internal consistency ω-t reliability was .75 and .78 for the two effort measures. After each test, subjects also completed the 10-item Sundre and Thelk (2007) Student Opinion Scale. Reliability was ω = .80 and .81 for the two SOS tests.
Procedure
Subjects completed testing online. After consenting, subjects completed Form A of the paper folding test, followed by the completion of the effort questionnaire. Next, half the subjects at random were selected for the motivation condition, receiving the message, “In this second part of the study, you will be given the opportunity to earn an additional £2 if you can improve your test performance by one or more items. The test is very similar to the first test you completed. You will also have the same amount of time to complete the test. We will score both tests and if your score is higher on the second test, you will be awarded a bonus £2 pounds.” An attention check (identifying if the incentive was nothing, £2, or 10 pence) had to be passed before proceeding to complete the prospective effort measure, followed by the second cognitive test, followed by the SOS. All participants (100%) passed the attention check, confirming awareness of the incentive condition.
Results
For descriptive statistics, see Table 1. Before continuing to the causal modelling, we began by simply examining in linear models the association of effort with cognitive scores, with effort assessed post-test-performance using the SOS.
For both the first and second block of cognitive assessment, SOS effort was associated with cognitive score (β = .11 [0.03, 0.2], t = 2.55, p = .011 for block 1, and 0.19 [0.1, 0.28], t = 4.35, p < 0.001 for block 2). However, for the pre-test measures of effort intention, this association was absent, with a non-significant association in the wrong direction for block 1 (β = -0.05 [-0.14, 0.04], t = -1.12, p = .262) for block 1 and non-significant for block 2 (β = .09 [0, 0.17], t = 1.92, p = .055).
We evaluated the core hypothesis that effort causally increases cognitive ability using the model shown in Fig 2. The two relevant parameters are 𝛽1 and 𝛽2 – the paths “incentive effort” and “effort score” respectively (see Table 2).
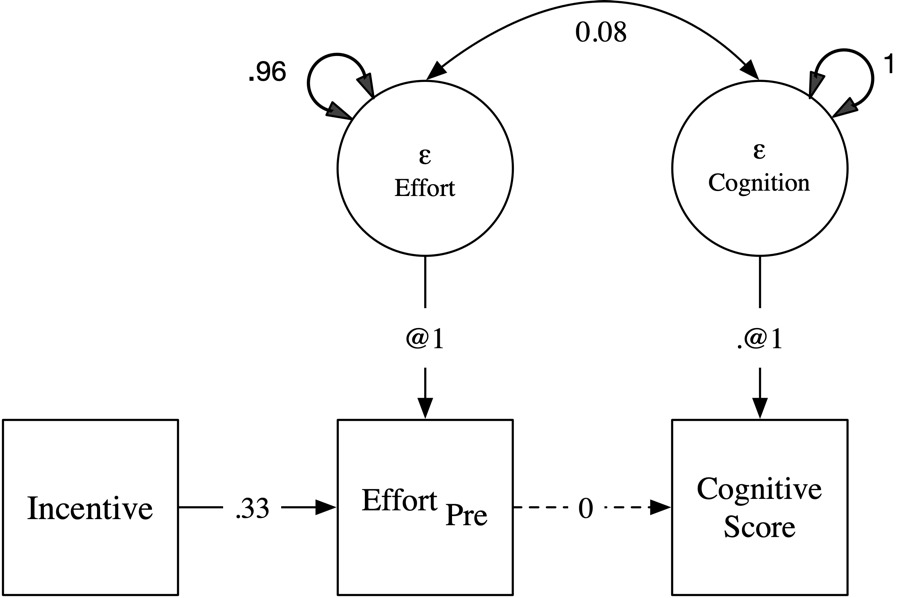
Validating the instrument (incentive) as having a strong and statistically significant increasing effect on effort, 𝛽1 was estimated at 0.18 and this was highly significant (χ²(1) = 10.80, p = .001). The effect of effort on scores, however, was estimated near-zero (𝛽2 = .04) and could be fixed at zero no statistically significant loss of fit (χ²(1) = .02, p < .886). This simpler model also showed the lowest AIC (see Table 2). A model with no effect of effort on cognitive scores was therefore the preferred model (see Figure 3 for a graphical version of this final model).
As we had administered the SOS, we could also apply this causal model to effort assessed using the SOS. Interestingly, this model supported the same conclusions: Incentive increased reported SOS effort (χ²(1) = 16.12, p < 0.001), but the path from SOS effort to cognitive score could be dropped without significant loss of fit (χ²(1) = .02, p= .89). The bivariate confounder path (ε in effort with ε in cognitive scores) was estimated at .19. This causal model for the SOS data indicates two things. First, there is zero causal effect of effort on scores. Second, the confounder path captures the reverse-causal association of post-test effort with performance as a strong cognitive performance influences a participant’s subsequent report of their effort.
Discussion
Study 2 showed a significant effect of the monetary incentive increasing effort. However, no statistically significant effect of effort on cognitive score was seen (see Figure 3). The results, then, disconfirm the claim that effort causally raises cognitive scores. This was also supported by the analysis of the confounded post-test SOS measure, which showed no evidence of causal impact for this measure of effort. It is worth noting also, that, in line with Bates and Gignac (2022), the differences between scores on Forms A and B of the paper folding test suggests a small practice effect.
The analysis of the SOS is consistent both with a lack of causal effects of effort on this post-test measure, and with evidence that this measure is confounded by awareness of performance. For instance Myers and Finney (2019) found that retrospective effort scores exhibited increased variance, suggesting that the retrospective measure blended clean prospective effort information with confounding from performance evaluation. They found that the unconfounded measure in their tasks showed a 55% decline in effect compared to the retrospective association (standardized beta of .16 versus .29). Together with other work, then, the present result indicates that the SOS is contaminated by subjects’ evaluation of their performance and that non-confounded measures of effort support zero causal effects on performance.
Jointly, the results suggest that links of effort with cognitive scores in designs with post-task measures of effort is illusory, reflecting reverse causation from performance impacting feelings of goodness of effort. We conclude that interpretations of effort-performance correlations as causal were mistaken. The present result instead supports the conclusion that effort does not increase test scores. However, we wished to confirm this finding in independent and larger dataset, and to evaluate its robustness. Therefore, we replicated the finding in study 3 below.
Study 3
The goal of study 3 was to replicate study 2 in an independent larger sample, testing robustness to the specific measure used to assess effort. We increased the sample size from 500 for study 2 to over 1,200 for study 3. We note that we had pre-registered that we would use to SOS to show once more that it correlates r ~ .28 with cognitive score. On reflection, as this was by now already well-demonstrated, we made a decision after registration but before data collection began to omit the SOS. Doing this reduced testing time by approximately 2 minutes per participant, enabling an increase in sample size from 1,000 to 1,237. Given prior evidence of SOS’s correlation with cognitive scores (r ~ .28, Silm et al., 2020), its inclusion was deemed unnecessary. Finally, to show robustness of the null finding to measures and to verify the outcome was not restricted to using the scale developed in study 1, we varied the measure of effort to one developed independently. In study 3, effort was measured using a 6-item effort measure based on a scale developed for the large Swedish TIMSS study (Eklöf, 2010) and modified by Penk and Richter (2017) who also validated this as a pre-test measure of effort.
The pre-registered hypotheses of Study 3 (aspredicted.org #124312) were as follows:
-
Incentive (randomised reward for increasing score over that achieved on the matched baseline test) will increase effort* (parameter 𝛽1).
-
Causal effect of effort on cognitive score (parameter 𝛽2) will be non-significant (strong version of hypothesis).
We also registered a fallback from claim 2, namely that if any causal effect of effort were to be found on cognitive score, that it would be small (0 to 2 IQ points).
Methods
Sample
We recruited adult participants on prolific academic (N = 1,237, age M = 42, SD = 14.1, 613 male and 613 female). The sample was Asian 74; Black 36; Other 41; Southeast Asian 9; White 1,077. Subjects received £1.20 for their participation (excluding bonus). We excluded participants from earlier studies using the Prolific Academic feature to filter IDs to ensure no overlap.
Materials and Procedure
Effort was measured using the 6-item scale developed by Penk and Richter (2017). An example item is “I feel motivated to do my best on this test”. Responses on a scale from 1: strongly disagree to 4: strongly agree. Reliability of the effort measure was ω = .80. The same cognitive tests as used in study 2 were used. In this sample, ω-t reliabilities were .76 and .67 for Form A and B respectively.
The procedure was identical to that used in study 2 with the exception that the SOS was not administered. After testing, subjects complete a very brief effort questionnaire (NASA TL-X: Hart & Staveland, 1988) piloting use of this measure for unrelated studies on conscientiousness.
Results
Descriptive statistics are presented in Table 3.
Analyses were pre-registered and conducted in the same manner as in study two – using the instrumental variable structural model to evaluate parameters 𝛽1 (the effect of incentive on effort) and 𝛽2 (the effect of effort on scores) parameters with χ² comparisons with 1 degree of freedom to the baseline model.
The pre-planned tests were 1) Test if 𝛽1 is significant. If not, the analyses would end, and we would seek a more effective incentive to increase effort. 2) Given a significant effect of the incentive on effort, we would test if 𝛽2 was non-significant (could be dropped without significant loss of fit). We predicted 𝛽2 would be small and non-significant. If so, our strongest prediction would be supported: that effort has no causal effect on cognitive score. A fallback was that, if 𝛽2 could not be dropped, then its size would be assessed; If small (≤.2), then a less restrictive prediction would be supported, namely that effort has only a small causal effect on cognitive score.
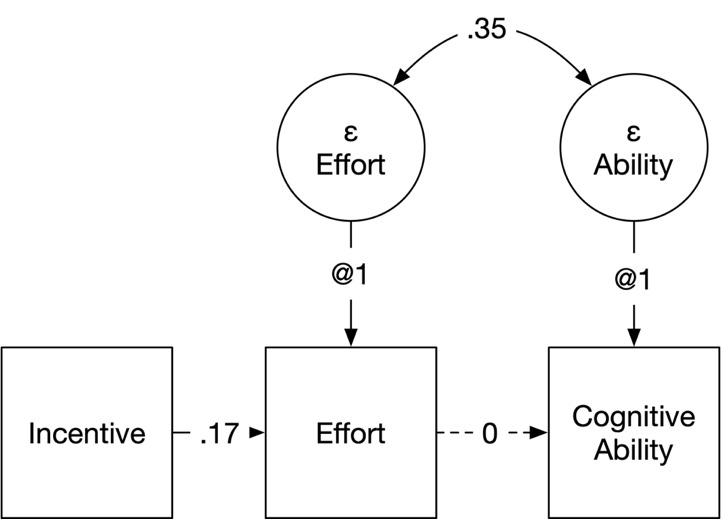
The results for each of these pre-registered hypotheses are shown in Table 4. A model setting 𝛽1 to zero showed a highly statistically significant effect of the incentive on effort (χ²(1) = 28.05, p <.001). This validated the incentive manipulation and permitted moving to testing hypothesis two. This was assessed by setting 𝛽2 to zero and evaluating the effect on model fit. As seen in Table 4, setting the effect of effort on cognitive ability to zero had no significant effect on model fit (χ²(1) = 2.08, p = .149). The final preferred model, then, was one in which incentive raised effort, but effort did not increase cognitive ability (see ). The point estimate for b2 was larger, but the wide confidence interval included zero (β2 = .27 [-0.07, 0.62]). These results closely mirrored those obtained in study 2, showing replicability and robustness to the measure of effort, and rejecting for a second time any effect of effort on cognitive scores – combining the results for the effect of effort on cognitive score across study 2 and study 3 using Fisher’s method (Fisher, 1925), yields an overall p-value of 0.40.
Discussion
Supporting the reliability and robustness of the results to the specific measure of effort, study 3 closely replicated study 2. The pre-planned test that incentive effectively increased effort was supported, and no effect of effort on cognitive test score was found. While the point estimate for 𝛽2 was 0.27, the wide confidence interval includes zero. The wide confidence interval in study three suggests to us that the alternative effort measure was not as precise or efficient at estimating effort as that developed by us in Study 1. This measure may introduce more noise, leading to less precise estimates. In future work, researchers should directly compare the psychometric properties of these pre-test measures in an independent replication.
Jointly, these findings support the hypothesis that effort does not causally raise cognitive score. Both studies, then, showed that, while incentives reliably and substantially manipulated effort, increased effort did not manifest in any statistically or theoretically significant causal effect on cognitive scores. We next discuss the overall findings and their implications for research and policy around effort and cognitive ability.
General Discussion
The results from these two large studies, yielding a combined p-value of .40 for the causal effect of effort on cognitive score, compel a major reinterpretation of the relationship between effort and cognitive performance. Alongside retractions for fraud (Warne, 2022) of studies driving earlier claims of large associations of effort with cognitive scores, modern, large, studies already indicated that the maximum association is around .16 (Bates & Gignac, 2022). These studies suggested that the causal fraction of this association may be smaller than even this, and perhaps zero. The present result, adopting a framework capable of testing causality and avoiding confounds present in earlier designs. The results suggest that any causal impact of effort on cognitive scores is negligible or absent, consistent with a true effect size near zero.
At least three conclusions follow from this work. First, the validity of cognitive scores as predictors of performance, while already supported by overwhelming external validity data (Ones & Viswesvaran, 2023), is given additional support. Moreover, the null role of effort indicates that the IQ-performance association is due to ability rather than confounds such as, say, conscientiousness. Users of ability tests should be assured that ability tests effectively recruit reasoning and accurately assess intelligence when used as designed.
Second, influential meta-analytic claims of causal effects should be abandoned as being both discredited (Warne, 2022), and now, refuted. Finally, the results are important for what they imply about the nature of cognition and of effort. Just as Francis Crick’s (1958) ‘Central Dogma of Molecular Biology’ importantly conjectured that information could not flow back from protein to DNA, the present results suggest a potential ‘central dogma of cognition’: that volitional effort can direct cognitive resources but cannot fundamentally alter or bypass the efficacy of the underlying cognitive systems themselves.
These results, then, move beyond prior empirical tests to imply that effort may have no mechanistic means of raising cognitive function. In the language of cognitive neuropsychology, cognitive ability is ‘encapsulated’ from the influence of effort. By analogy with perceptual systems, while motivation can direct where one looks, exhorting an individual to ‘try harder’ cannot alter the fundamental sensitivity of their visual system if a stimulus is below their perceptual threshold.
Limitations & Future Research
The present work should not be interpreted as implying that effortful goal-directed action and conscientiousness do not cause valuable results – conscientiousness has universally positive outcomes (Moffitt et al., 2011), and the role of effort on tasks where ability is not a limiting factor but which instead rely on ambitious goals and persistence in pursuing these over time is robust (Bates et al., 2023). Recent work studying physical (Bates, 2025) and cognitive effort (Bates, 2024) suggests that conscientiousness decouples effort from the frustration that otherwise acts to terminate effort. The present research does not contradict this body of work. Instead, it addresses the remarkable-if-true question of whether the desirable side-effects of effort extend to improving intelligence. This would be remarkable, but here, we rule this out.
A strength of the design was that subjects in both arms of the study are asked about intended effort, balancing any effects of the measure on performance. Importantly, asking people to verbalise intended higher effort has been shown to increase effort via behavioral commitment effects (Manstead & Eekelen, 1998). Thus the measure in the experimental group should have induced larger not smaller effects of the incentive on performance (Carver & Scheier, 1998).
A key implication of these findings is that educators seeking to improve cognitive outcomes should focus on methods with proven efficacy, such as spaced recall and systematic time on task (Hattie, 2023), rather than expecting that simply motivating students to try harder will raise their underlying ability. A second implication is that effort research should be emphasised for its beneficial effects on “non-cognitive” pathways to success – for instance improved goal setting (Bates et al., 2023). It is also worth noting that the present lack of effect of effort on ability may inform research on the inverse question: whether doing cognitive work reduces the ability to do future effort, the so-called resource model of willpower. Lin, Saunders, Friese, Evans, and Inzlicht (2020), for instance, found that, prior effort does not reduce the accuracy of a subsequent information processing task. This null result is compatible with the present data in supporting the impermeability of cognition to effort, whether prior or contemporary.
Conclusion
The present studies, based on instrumental variable analysis of an appropriate RCT design in two large samples, supported the absence of effects of effort on cognitive performance. The results suggest earlier results reflected confounded effects of ability on effort and post-test re-evaluation of effort. While effort has important motivational functions, enhancing intelligence or intellectual performance is not one of them.
Funding
Support for this project was provided in part by The John Templeton Foundation (US GF13666.154364).
Data Availability
Pre-registrations are available at https://researchbox.org/790