
Introduction
Spearman’s Hypothesis (SH) is a term coined by Arthur Jensen (1923-2012) to describe the finding that tests with greater g saturation (i.e., those that better measure the general factor of intelligence) are more predictive of the magnitude of the mean performance difference between White and Black (W-B) socially identified racial groups on those tests (Jensen, 1985, 1998). This “hypothesis” was so named because this pattern had first been noted qualitatively by Charles Spearman (1863-1943) in his book The Abilities of Man (Spearman, 1927, p. 379).
SH has been mostly tested using Jensen’s method of correlated vectors (MCV). This involves estimating the g saturation of subtests comprising a sufficiently diverse battery, then estimating the performance disparities across the subtests between the groups being compared (typically scaled in terms of standard deviation units, or d), then finally correlating the two effect size vectors, either using the Pearson or Spearman rank-order approach (Jensen, 1998). Employing 17 different studies examining W-B differences, sourced from Jensen (1985) and elsewhere, Jensen (1998) found strong evidence for SH (r=0.63). A more recently published formal meta-analysis of SH in 10 adult US W-B studies also found strong evidence for the effect (ρ=0.57, K=15 effect sizes) (te Nijenhuis & van den Hoek, 2016).
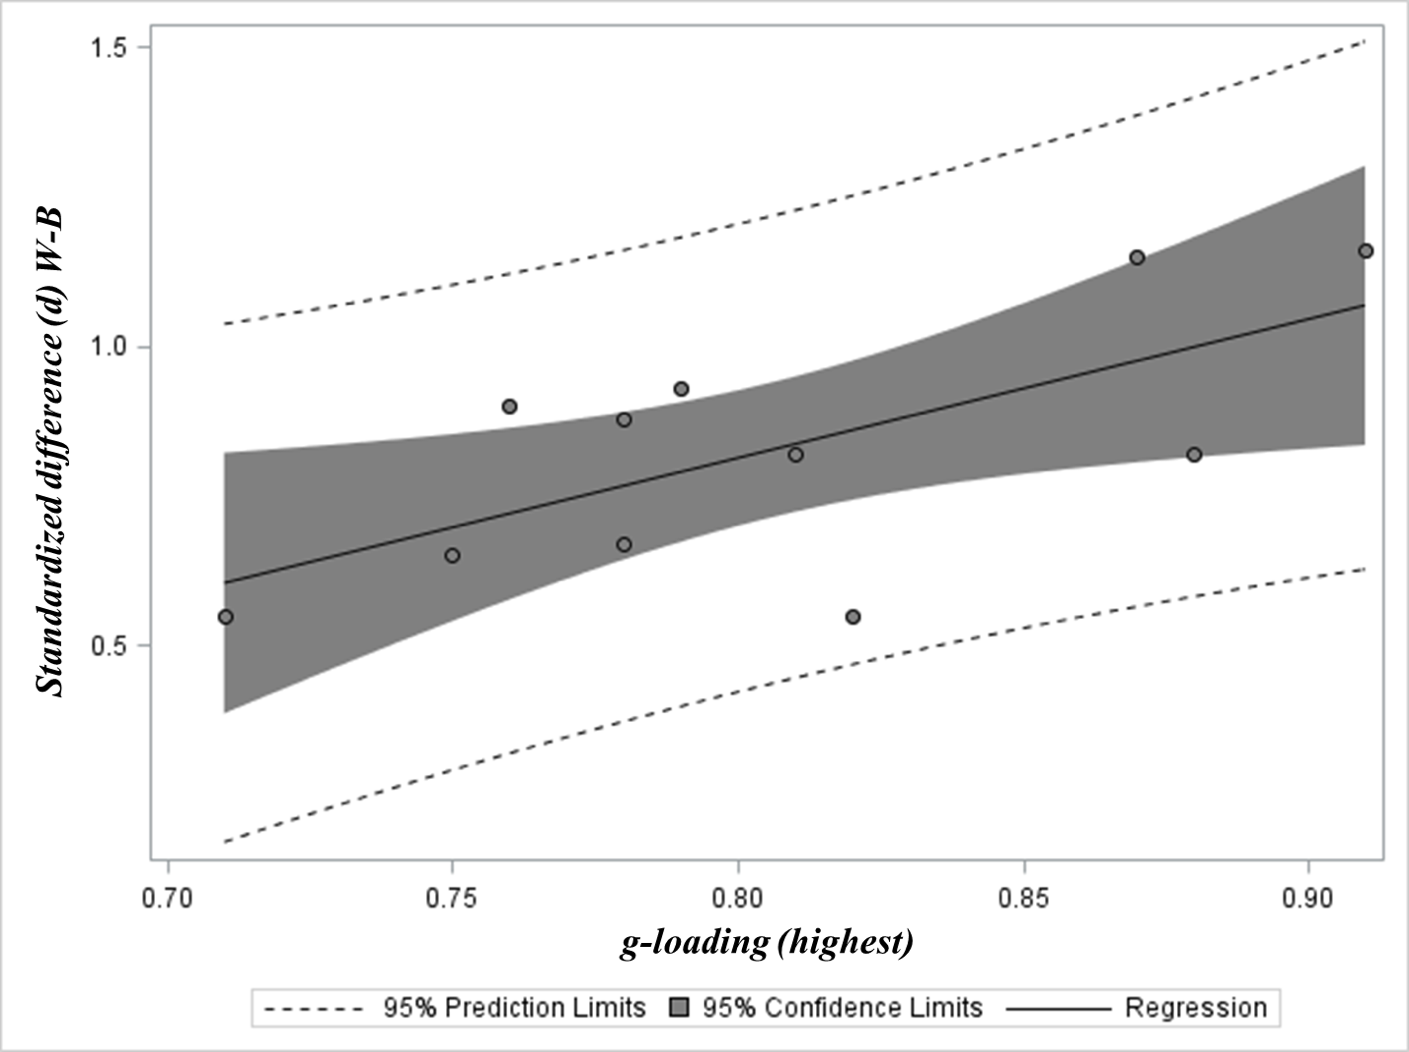
Figure 1 provides a visual illustration of MCV using data sourced from Jensen (1985). In Table 2 (p. 203) Jensen presents g loadings for 11 subtests selected from batteries on the basis of their having the highest loadings and presents these along with their corresponding standardized W-B difference scores (difference between White and Black mean performance divided by subtest standard deviation).
_between_vectors_of_standardized_w-b_d.png)
The correlation between the two vectors in the above example is 0.667 (95% CI=0.112 to 0.904, n=11 subtests). Such positive correlations between vectors of g loadings and other effects have been termed “Jensen Effects” (Rushton, 1998).
Evidence for SH has also been found in comparisons involving Whites and other socially identified racial and ethnic groups, such as Hispanics (te Nijenhuis et al., 2019), American Indians (te Nijenhuis, van den Hoek, et al., 2015), and European and Oriental Jews (te Nijenhuis, David, et al., 2014). Exceptions to this pattern have been identified in certain other ethnic group comparisons, however (e.g., te Nijenhuis et al., 2017).
MCV and its limitations
MCV has been criticized on several grounds. Some of these criticisms are flawed, such as the claim that it always yields “Jensen Effects” making confirmations of SH artefactual (as originally claimed by Schönemann, 1989). A range of phenomena do in fact show the opposite pattern, i.e., negative moderation by g, or an “anti-Jensen Effect.” Notable examples include adoption-related IQ gains (te Nijenhuis, Jongeneel-Grimen, et al., 2015), gains from educational interventions (such as Head Start; te Nijenhuis, Jongeneel-Grimen, et al., 2014), and Flynn-Effect gains (te Nijenhuis & van der Flier, 2013).
A more fundamental criticism concerns whether or not the latent variable involved in these correlations can be reliably identified with g (Dolan, 2000). Spearman’s (1927) Principle of the Indifference of the Indicator suggests that it is generally safe to assume that arbitrarily selected subtests can be reliably ranked in terms of g saturation, owing to the apparent ubiquity of this latent variable across diverse cognitive ability measures and populations (Warne & Burningham, 2019). However, unbalanced sampling of subtests with respect to narrower cognitive domains can yield deceptive results, where non-g group factors might be driving the moderation patterns instead (Ashton & Lee, 2005). Jensen (1998) anticipated this limitation, however, and provided guidelines to avoid misleading results through balanced sampling of subtests so as to ensure adequate nomological breadth. It should be noted also that MCV cannot be used to determine the degree to which two populations exhibit measurement invariance with respect to a given latent variable, although the method clearly assumes invariance. The finding of a “Jensen Effect” in a test of SH might give the false impression that two populations differ on a common latent factor, when in fact there may be configural and/or other differences between the factors, when estimated for each group separately, making them incommensurable. But alternative methods, such as multi-group confirmatory factor analysis, can be used to directly address this important issue (e.g., Dolan, 2000).
J. Philippe Rushton’s method and the causes of SH
A key question is what causes SH. By far the most controversial application of MCV has been in its use as a line of evidence for the view that SH supports a role for genetic or biological influences on W-B, and other socially identified racial and ethnic group, differences (Warne, 2021), the idea that there are such influences being the racial-hereditarian hypothesis (RHH). Rushton (1999), who was a major proponent of RHH, developed a method involving factor analysis where vectors (rather than subjects) were used as the unit of analysis and which attempted to address the topic of causation in SH. Rushton (1999) sourced vectors of various effect sizes reflecting both genetic and environmental influences on subtest performance in addition to g loadings and W-B differences. It was argued that clustering among these vectors might yield evidence for the RHH if a positive manifold emerges among vectors of genetic influences, g loadings, and W-B differences, but excludes environmental ones. In testing this, Rushton (1999) conducted principal component analysis on a correlation matrix generated using a set of nine vectors, reflecting subtest-level W-B differences, two sets of g loadings (from both WISC-III and R), inbreeding depression effects, and four sets of Flynn-Effect vectors, all estimated with respect to the subtests of Wechsler series tests. His analysis yielded two factors, one onto which loaded the vectors of g loadings, W-B differences, and inbreeding depression, and another, onto which loaded the four Flynn-Effect vectors. Rushton argued that this indicated that some portion of the W-B difference is a function of genetic effects (as indexed in this specific instance by their clustering with the inbreeding-depression-effects vector).
Subsequent research has challenged Rushton’s interpretation. Most notably Kan (2011) conducted a comprehensive re-analysis of the data in Jensen (1985) and elsewhere, finding that while positive correlations exist among vectors of W-B differences, g loadings, and subtest heritability estimates, much of the variance in SH can be accounted for by the culture loadings of these subtests, indicating that performance on them is dependent on culture-bound acquired knowledge, which is of course related to environmental effects, e.g. upbringing and education (Freese & Jao, 2017). A recent application of Rushton’s method revealed that the degree to which experiences of racial and ethnic discrimination reduce the expressivity of polygenic scores associated with educational attainment on g is also a “Jensen Effect,” exhibiting positive clustering with vectors of g loadings, SH (estimated using three-way comparisons of Black, White, and Hispanic performance differences), and shared environmental (c2) effects on IQ (Peñaherrera-Aguirre et al., 2022). These findings are all broadly consistent with Kan’s thesis that cultural factors, especially those that act via shared environmentality, can be a major source of SH, weakening hereditarian interpretations of these patterns.
The current study
Non-shared environmental effects (e2) reflect influences on subjects that reduce phenotypic resemblance among relatives (Plomin, 2024). e2 effects on cognitive performance are generally stronger than ones stemming from the shared environment (Bouchard, 2013), with the latter being more potent early in life, and weakening as heritability increases with age (the increase in heritability with age being the Wilson Effect; Bouchard, 2013).
How might e2 affect SH? e2, which is a within-group parameter, and by extension its between-group counterpart are sources of phenotypic dissimilarity. As these sources of environmentality are random, having effects that are very similar to measurement error (Plomin, 2024), e2 should therefore attenuate correlation patterns among phenotypes, weakening g saturation in instances where it is most pronounced. In cases where is the primary cause of W-B differences, i.e., where there exist differences in the levels of e2 between groups, we would expect therefore to find a failure of SH, with more g-loaded subtests being less predictive of W-B differences. A plausible source of is environmental harshness, a dimension of environmental risk characterized by high variance in both actual and perceived morbidity and mortality (Ellis et al., 2009). It has been speculated that humans may possess an innate repertoire of harshness-adapted cognitive abilities (so called hidden talents; Ellis et al., 2023) which are ordinarily difficult to measure suggesting that their expression is highly situation-dependent and therefore they do not (generally) participate in the positive manifold. Group differences resulting from the differential expression of these will, contra SH, not manifest as differences in g.
Consistent with this model, a recent study by Sng and colleagues (2024) found that subject perceptions of social race are confounded with perceptions of environmental harshness, such that Black social-racial attribution becomes conflated with harsher environments. This is consistent with biosocial models of race in which social race acquires tangible biological qualities by virtue of, e.g., inequitable niche construction (Henry et al., 2023), and suggests that disparities in environmental harshness might function analogously to a racialized Factor X, a hypothesized source of variance that acts between groups to generate differences in the levels of a trait, but has no (or rather no directionally consistent) effect on the levels of that trait within groups (Jensen, 1973).
A line of evidence consonant with the existence of a Factor X in group differences comes from meta-analytic studies of SH in incarcerated populations (i.e., those who had been institutionalized for “delinquent behavior” or who were imprisoned), where it has been found that SH is inverted (the W-B difference tends to be an “anti-Jensen Effect”) (te Nijenhuis et al., 2017; van den Hoek, 2015). Incarceration environments, such as those encountered in prisons, are associated with elevated levels of harshness, stemming from adverse interactions among inmates and possibly other personnel also, in the form of violence and victimization patterns that strongly track with socially identified race (Carroll, 1974). Ross and Richards (2002) describe a phenomenon termed the “color line” in prison settings, involving pervasive racialized patterns of both collective (e.g., riots, ganging) and interpersonal violence (see also Bloch & Olivares-Pelayo, 2023). The salience of social race is therefore massively amplified in such populations, creating opportunities for the emergence of disparate and strongly racialized environmental impacts on cognitive functioning.
In the current study the possibility that these reversals of SH in the context of incarcerated populations track with subtest sensitivity to e2 will be tested using vectors of W-B differences sourced from both incarcerated and normative samples evaluated using Wechsler series tests. Rushton’s (1999) factor-analytic method will be employed to identify salient patterns of clustering. The following hypotheses will be tested:
H1: Strong positive clustering should be observed among vectors of e2 and the incarcerated W-B difference vectors.
H2: Strong positive clustering should be observed among vectors of g and culture loadings, and normative W-B differences (consistent specifically with predictions made in Kan, 2011 concerning the cause of SH).
H3: These clustering patterns will form distinct factors.
Methods
Data
The vectors for each variable were sourced from Wechsler series tests in all cases.
-
Normative W-B difference data: For the normative samples, one of the most extensive studies of W-B differences at the subtest level is that of Kaufman, McLean, and Reynolds (1988), who present data on W-B differences by WAIS-R subtest for four different age ranges (16-19, 20-34, 35-54, and 55-74) (see Table 2).
-
Incarcerated W-B difference data: SH in the context of incarcerated populations was meta-analyzed by van den Hoek (2015), who identified four relevant effect sizes (Destephens, 1953; Jensen & Faulstich, 1988; Panton, 1960; and one hybrid effect size derived from combining two separate studies with comparable samples: Altus & Clark, 1949, and Franklin, 1945). The effect sizes derived from the oldest set of studies (Altus & Clark, 1949 + Franklin, 1945 and Destephens, 1953) were estimated using 10 subtests of the Wechsler-Bellevue test (without vocabulary), a precursor to WAIS. Altus and Clark (1949) report subtest performance means for a White subsample aged 14 to 18 who had been institutionalized for “juvenile delinquency.” Franklin (1945) provides subtest-level data on a comparable Black institutionalized sample aged from 10 to 20. Panton (1960) used WAIS and Jensen and Faulstich (1988) employed WAIS-R, in both cases on prison populations. In three of the four studies, SH was disconfirmed, with the W-B difference being an “anti-Jensen Effect” (range r=-0.03 to -0.46). In Panton (1960) the effect was positive (r=0.73), although van den Hoek (2015) noted that this study was of “low quality” because the participants had prior exposure to the test. On the basis of this, the effect size was excluded from subsequent analysis. Relevant subtest-level W-B effect sizes were recomputed for the remaining studies using the original data in these papers.
-
Non-shared environmentality: Estimates of subtest e2 variance were derived from two studies. Rijsdijk, Vernon, and Boomsma (2002) generated estimates of behavior-genetic variance components for each of the 11 WAIS subtests (Table 3). e2 variances were recomputed directly from the monozygotic and dizygotic twin correlations using Falconer’s equation (after first estimating h2 and c2) as follows:
e2=1-(h2+c2)
WAIS subtest-level estimates of e2 are also provided in the study of Tambs, Sundet, and Magnus (1984, Table 2).
-
g loadings: Reliability-corrected meta-analytic WAIS g loadings were obtained from Kan’s (2011) doctoral thesis (Table 3.7).
-
Culture loadings: Culture loading estimates were obtained for each of the WISC-III subtests from Table 3.1 in Kan (2011). Most of these values came from the study of Georgas, van de Vijver, Weiss, and Saklofske (2003, Table 18.1), with the value for Coding Speed having been obtained by Kan via personal communication with one of the authors of this paper.
The vocabulary subtest was dropped in all cases where effect sizes had been estimated using WAIS, WAIS-R, or WISC-III bringing the subtests into alignment with those available for the samples using the Wechsler-Bellevue test, yielding an n of 10 subtests per vector.
Statistical analyses
The youngest age group (16-19) from Kaufman et al. (1988) and the prison sample from Jensen and Faulstich (1988) had to be excluded as the dataset that included them was non-factorizable. Bartlett’s test, which is a more robust indicator of factorizability than the Kaiser-Meyer-Olkin test when case number is low (Johnson & Wichern, 2007), was applied to determine the suitability of the remaining nine vectors for exploratory factor analysis (EFA). This analysis was conducted using the cortest.bartlett function (psych package; Revelle, 2015). Horn’s parallel analysis was also computed with the fa.parallel function to identify the number of latent dimensions (psych package; Revelle, 2015). Lastly, a Principal Axis EFA was estimated, fixing the number of latent dimensions based on the results of the aforementioned parallel analysis. This model was estimated using the fa function (psych package; Revelle, 2015). All statistical analyses were performed using the R program (v.4.3.1). All code used in these analyses is made available in the Appendix. All subtest-level data on all vectors used in the current analysis, along with a correlation matrix, are presented in Table 1.
Results
Measurement models
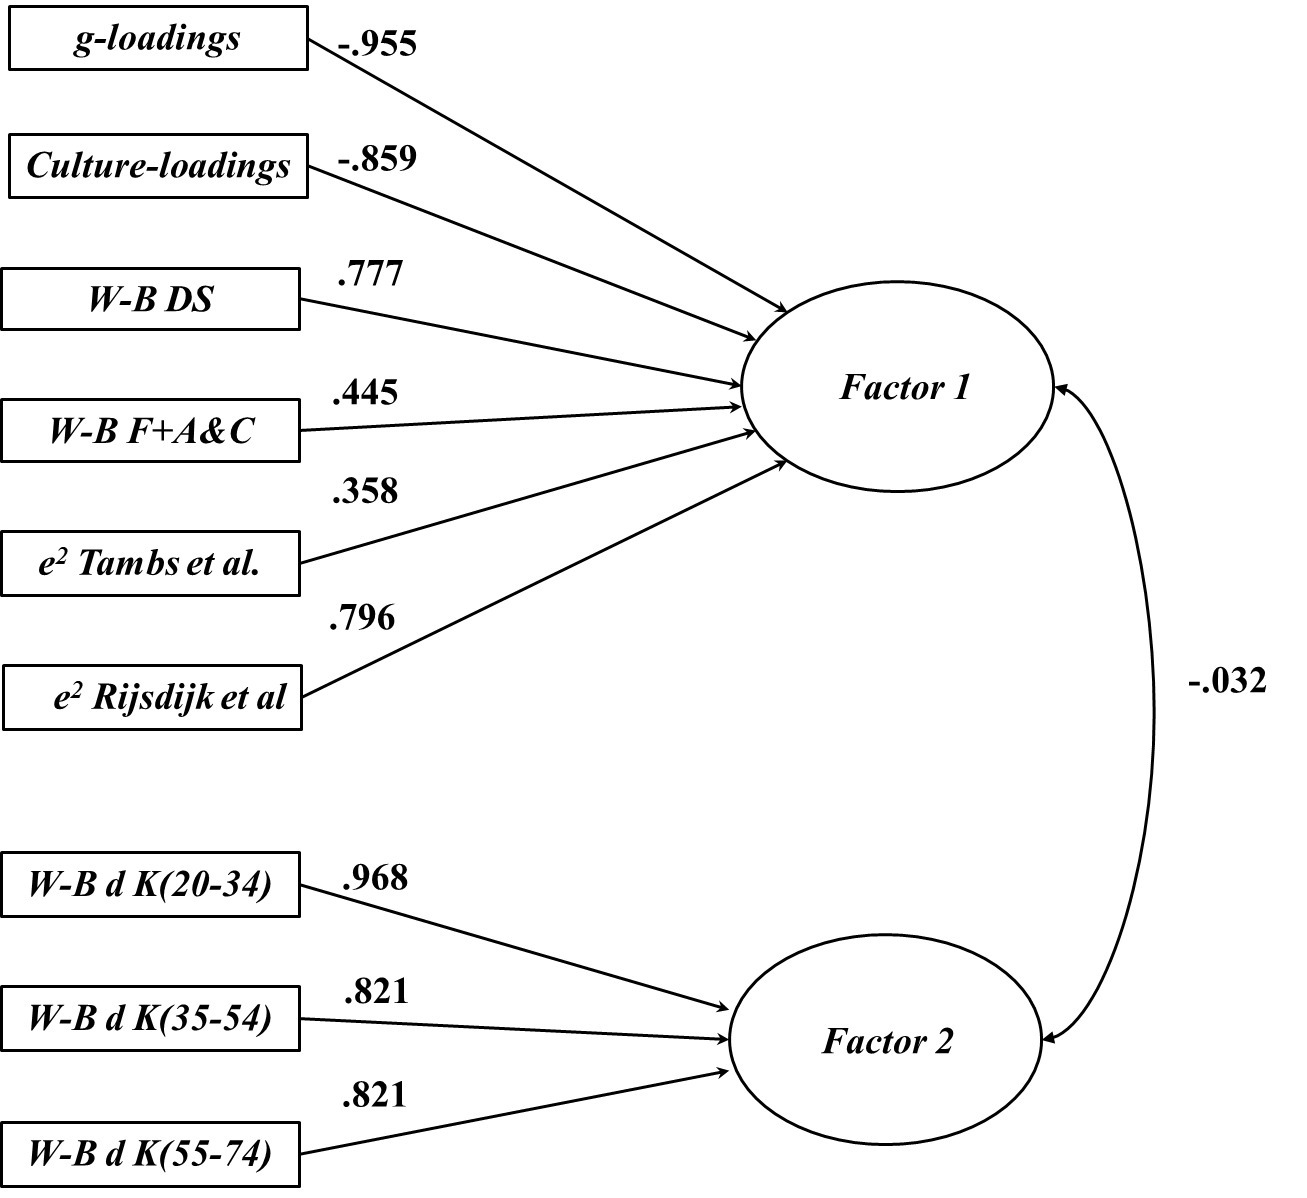
Bartlett’s test reached statistical significance (χ2= 116.167, p<.0001), with Horn’s parallel analysis recommending the extraction of two dimensions. A Principal Axis EFA was estimated by fixing the model to a two-factor solution. Factor 1 exhibited negative loadings for the g-loading vector sourced from Kan (2011) and also the culture loading vector sourced from Georgas et al. (2003). In contrast, Factor 1 exhibited positive loadings for the two subtest non-shared environmentality vectors sourced from Tambs et al. (1984) and Rijsdijk et al. (2002). Similarly, it was associated with positive loadings for the prison sample W-B difference vectors obtained from DeStephens (1953), and Franklin (1945) + Altus and Clark (1949). Factor 2 exhibited positive loadings for the three normative sample W-B vectors sourced from Kaufman et al. (1988). All loadings are reported in Table 2. Figure 2 illustrates the relevant factor pattern.
Discussion
Consistent with H1, positive clustering with respect to Factor 1 was observed among the two e2 and the two incarcerated W-B difference vectors, which suggests that e2 may be causal of these differences in this context. Consistent in part with H2, positive clustering was also observed among the three vectors of normative W-B differences, forming a distinct Factor 2. However, the vectors of g and culture loadings negatively co-loaded onto Factor 1, but cross-loaded only weakly (but positively) (λ=0.259 and 0.160 respectively) onto Factor 2, which is not consistent with H2. Moreover, the W-B difference vectors also cross-loaded onto Factor 2 (λ=0.636 and 0.380 for De Stephens and Franklin + Altus & Clark respectively), which suggests that there is some shared etiology between the normative and incarcerated W-B vectors, but only with respect to influences that are independent of g and culture loadings (by contrast the three normative W-B vectors all cross-load negatively onto Factor 1). The patterns of associations among the vectors comprising Factor 1, suggest that this factor might accurately be characterized as an anti-Spearman Hypothesis factor, with g and culture loading playing a central role in negatively co-moderating the magnitude of the incarceration group differences and associated (non-shared) environmental influences. Consistent with H3 the two factors were effectively orthogonal, exhibiting only a very weak negative inter-factor correlation (r=-0.032).
Within an incarceration context, sources of environmental harshness likely become highly racialized (as per the “color line” model; Ross & Richards, 2002). This could translate into group differences via amplification of the effects of broader synchronic socio-structural sources of inequality on incarcerated populations that generates acute Factor X-type effects (specifically, strongly discontinuous racialized between-group variation in the intensity of harshness patterns). Consistent with this, Sonderlund et al. (2022) have theorized that there are “pathways that focus on social cohesion and community-level chronic stress, community crime and police victimization, as well as infrastructural community disinvestment” that link “spatial and racialized clustering of incarceration … and disparities in adverse birth outcomes” (p. 1). Incarceration mechanisms, by virtue of their intergenerational persistence as part of the ecological inheritance system, are also clear sources of inequitable niche construction, whereby a population’s experience of ecological harshness and concomitant adverse health (and cognitive) disparities are diachronically conditioned by ecological legacy effects stemming from the persistence of these inherited institutions (Henry et al., 2023).
Pathways linking broader socio-cultural factors to disparate outcomes among incarcerated populations might account for the observation that, among the incarcerated W-B populations, there still are aggregate cognitive performance disparities in the commonly found direction (i.e., White > Black). Although the magnitude of these disparities is smaller in the case of the incarcerated populations (average d across subtests = .58 vs. .74 in the normative samples), perhaps reflecting a range-restriction effect stemming from the general negative association between IQ and contact with the criminal justice system (Hirschi & Hindelang, 1977).
In what ways might incarcerated W-B populations differ cognitively? As mentioned in the Introduction, the capacity to acquire certain sets of harshness-adapted cognitive skills, which are poorly indexed by conventional cognitive tests, such as those comprising the hidden talent framework, may play a critical role. Hidden talents in this context describe “stress-adapted skills [that] represent a form of adaptive intelligence enabling individuals to function within the constraints of harsh environments” (Ellis et al., 2023). Chronic exposure to harshness may elicit these narrower skills among incarcerated populations as evoked adaptations, which essentially “blossom” at the expense of the integrity of the g factor. Ability tilts (difference scores resulting from tradeoffs between two abilities) might be yet another manifestation of non-g hidden talents, differing in magnitude in White relative to Black populations (Coyle, 2016). A long-established theory maintains that incarcerated populations (relative to non-incarcerated ones) may exhibit a tilt toward spatial abilities (Matarazzo, 1972), so perhaps this might be a source of W-B differences in the incarceration context. In testing Matarazzo’s model, Jensen and Faulstich (1988) noted, however, that the effect was extremely weak once the difference in g between incarcerated and normative populations had been controlled. Another possibility is that the performance disparity is a function of differences in error rates, which would also be consistent with an effect of e2 on this disparity, as error variance is folded into measures of e2 (Plomin, 2024). Error in this context could also be an adaptive function of factors such as reduced attentional capacity in response to sources of heightened environmental harshness.
Thus, there are potentially many axes of non-g variance along which W-B populations could diverge when exposed to different levels of racialized environmental harshness. Being multivariate, such extra cognitive “degrees of freedom” could easily lead to non-invariant differences between groups, whereby individuals within such groups might employ a large range of effectively idiosyncratic cognitive strategies in solving test items. Thus, the W-B difference in the incarceration context is likely to be one of diverse kinds of cognitive strategies, rather than one of degrees of difference with respect to some common factor variance.
It should be noted that the studies reporting data on the two incarceration samples used currently are seven to eight decades old. Studies of such populations in situ are extremely rare. It would be ideal for more data of this sort to be obtained using larger, contemporary incarcerated populations to replicate the finding of an anti-SH effect in them. Populations of W-B individuals having to cope with other sources of elevated harshness could also be considered in future research. One potentially relevant set of environments are those with high levels of pollution, where it has been found that social race, rather than socio-economic status, is the more robust predictor of risk of living in such an environment (Lancet, 2018), suggesting that such settings may constitute another regime of racialized environmental harshness in which SH will fail. Potentially consistent with this is the observation that pollution affects subtest scores in a way that is typically associated with weak “Jensen” or “anti-Jensen Effects”. Woodley of Menie, Sarraf, Peñaherrera-Aguirre, Fernandes, and Becker (2018) conducted a small meta-analysis of the results of MCV applied to the impacts of various toxic substances on the pattern of subtest performance. These included lead, mercury, fetal alcohol and cocaine, and atmospheric pollution. The overall effect was found to be consistent with a weak “Jensen Effect” (ρ=0.11, 95% CI=0.08 to 0.14, n=3841). This indicates that much of the effects of pollutants and other toxic substances likely occur on non-g sources of subtest variance which is consistent with the speculation that polluted environments may at the very least significantly attenuate, or even reverse SH among Black and White populations exposed to them.
The current findings fit with the existence of environmental effects on the W-B difference, but only insofar as the patterns of co-moderation are compatible with an inference of causation. This finding highlights the importance of making clear testable predictions concerning potential causal influences on these differences. Proponents of racial-environmental hypotheses (REH) frequently fail to make predictions of a sort that would substantiate or falsify their claims, and in some cases even suggest that such predictions cannot be made (e.g. Kaplan, 2015).